Son kullanma tarihi geçmiş, bayatlamış bir tarayıcı kullanıyorsanız, Mercedes kullanmak yerine tosbağaya binmek gibi... Web sitelerini düzgün görüntüleyemiyorsanız eh, bi' zahmet tarayıcınızı güncelleyiniz. Modern Web standartlarını karşılayan bir tarayıcı alternatifine göz atın.
R5 5600 RX 580 sistemde oyun oynarken mavi ekran hatası
CPU#0
--------------------------------------------------
Current DPC: No Active DPC

Pending DPCs:
----------------------------------------
CPU Type      KDPC       Function
 0: Normal  : 0xffffde0f2599ddb8 0xfffff807c3ef1010 HDAudBus!HdaController::NotificationDpc
 0: Normal  : 0xffffde0f258f53f8 0xfffff8076c477800 ndis!ndisInterruptDpc
 0: Normal  : 0xfffff8076823bc20 0xfffff807678b1b40 nt!PpmCheckPeriodicStart
 0: Normal  : 0xfffff80768242240 0xfffff80767977070 nt!KiBalanceSetManagerDeferredRoutine
 0: Normal  : 0xffffde0f1b9fc278 0xfffff807679eb870 nt!EtwpLoggerDpc
 0: Threaded: 0xfffff807648d0758 0xfffff80767b6bfc0 nt!KiDpcWatchdog
Name:
HDAudBus.sys
Info:
High Definition Audio Bus Driver
Source:
Windows Update
* İlk etapta ses sürücüsünde bir problem görüyorum.
* Kullandığınız anakarttaki ses çipinin sürücüsüne güncelleme gelmiş. Sizdeki eski.
* Eskisini silip yenisini kurabilirsiniz.
amdkmdag.sys =AMD kernel sürücüsü - AMD grafik sürücüsü
* Sorun yüksek ihtimalle ses sürücüsündendi, ama her ihtimale karşı DDU yardımıyla AMD ekran kartı sürücülerinizi temizleyip güncelini yükleyebilirsiniz.
- Güncel sürücüyü indirin: Radeon™ RX 580 Drivers & Support
- İnterneti kesin.
- Daha sonra DDU ile Sürücü Kaldırma rehberini takip edin.
- Sürücüyü kaldırdıktan sonra bilgisayar yeniden başlayacak.
- Bilgisayar açılınca indirdiğiniz sürücüyü kurun.
- İşlemler bitince interneti bağlayın.
* Bu arada, chipset sürücülerinizi nereden yüklüyorsunuz bilmiyorum ama anakartın kendi destek sayfasındaki sürücüler biraz geriden geliyor, özellikle MSI tarafında gördüğüm kadarıyla böyle. AMD sitesinden yüklemenizi tavsiye ederim.
CPU#0
--------------------------------------------------
Current DPC: No Active DPC.

Pending DPCs:
----------------------------------------
CPU Type KDPC Function.
 0: Normal : 0xffffde0f2599ddb8 0xfffff807c3ef1010 HDAudBus!HdaController::NotificationDpc
 0: Normal : 0xffffde0f258f53f8 0xfffff8076c477800 ndis!ndisInterruptDpc
 0: Normal : 0xfffff8076823bc20 0xfffff807678b1b40 nt!PpmCheckPeriodicStart
 0: Normal : 0xfffff80768242240 0xfffff80767977070 nt!KiBalanceSetManagerDeferredRoutine
 0: Normal : 0xffffde0f1b9fc278 0xfffff807679eb870 nt!EtwpLoggerDpc
 0: Threaded: 0xfffff807648d0758 0xfffff80767b6bfc0 nt!KiDpcWatchdog
Name:
HDAudBus.sys
Info:
High Definition Audio Bus Driver
Source:
Windows Update
* İlk etapta ses sürücüsünde bir problem görüyorum.
* Kullandığınız anakarttaki ses çipinin sürücüsüne güncelleme gelmiş. Sizdeki eski.
* Eskisini silip yenisini kurabilirsiniz. Eki Görüntüle 1803902
amdkmdag.sys =AMD kernel sürücüsü - AMD grafik sürücüsü.
* Sorun yüksek ihtimalle ses sürücüsündendi, ama her ihtimale karşı DDU yardımıyla AMD ekran kartı sürücülerinizi temizleyip güncelini yükleyebilirsiniz.
- Güncel sürücüyü indirin: Radeon™ RX 580 Drivers & Support
- İnterneti kesin.
- Daha sonra DDU ile Sürücü Kaldırma rehberini takip edin.
- Sürücüyü kaldırdıktan sonra bilgisayar yeniden başlayacak.
- Bilgisayar açılınca indirdiğiniz sürücüyü kurun.
- İşlemler bitince interneti bağlayın.
* Bu arada, chipset sürücülerinizi nereden yüklüyorsunuz bilmiyorum ama anakartın kendi destek sayfasındaki sürücüler biraz geriden geliyor, özellikle MSI tarafında gördüğüm kadarıyla böyle. AMD sitesinden yüklemenizi tavsiye ederim.
* Bir önceki mavi ekranda olan sorunlar yok.
* İşlemciye uygulanan bir undervolt veya overclock ile alakalı bir durum olabilir.
* BIOS'tan veya Ryzen Master'dan böyle bir işlem gerçekleştirdiniz mi?
* Stabil olmayabilir. Yaptıysanız geri çekin şimdilik.
* RAM'ler A2 ve B2'ye takılı değil mi?
* BIOS hala güncel değil, bir ara güncelleyin.
* RAM'leri XMP açık kullanıyorsunuz değil mi?
RAM'lere OC uygularken:
XMP profili ile mi seçim yaptınız?
Yoksa elle frekans seçimi/voltaj/timing vs. değişimi mi yaptınız?
* Bir önceki mavi ekranda olan sorunlar yok.
* İşlemciye uygulanan bir undervolt veya overclock ile alakalı bir durum olabilir.
* BIOS'tan veya Ryzen Master'dan böyle bir işlem gerçekleştirdiniz mi?
* Stabil olmayabilir. Yaptıysanız geri çekin şimdilik.
* RAM'ler A2 ve b2'ye takılı değil mi?
* BIOS hala güncel değil, bir ara güncelleyin.
* RAM'leri XMP açık kullanıyorsunuz değil mi?
RAM'lere OC uygularken:
XMP profili ile mi seçim yaptınız?
Yoksa elle frekans seçimi/voltaj/timing vs. değişimi mi yaptınız?
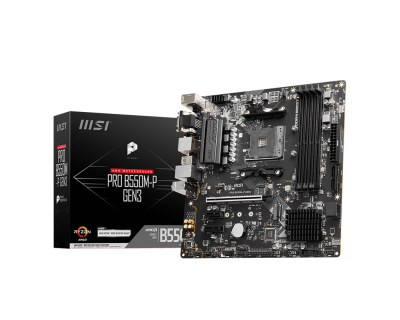
To release AMD Ryzen AM4 processors, the PRO B550M-P GEN3 offers Core boost and DDR4 Boost. Equipped with Turbo M.2 and 1G LAN, it provides the access to the latest peripheral connectivity standards.
 drive.google.com