Son kullanma tarihi geçmiş, bayatlamış bir tarayıcı kullanıyorsanız, Mercedes kullanmak yerine tosbağaya binmek gibi... Web sitelerini düzgün görüntüleyemiyorsanız eh, bi' zahmet tarayıcınızı güncelleyiniz. Modern Web standartlarını karşılayan bir tarayıcı alternatifine göz atın.
Alınan BAD_POOL_CALLER ve MEMORY_MANAGEMENT hataları bunu destekler nitelikte.
TPM ile bağlantısı var ancak TPM modülünden gelen bilgiler RAM bellekte yanlış yorumlanıyor, yanlış veri havuzunda işlenmeye çalışılıyor.
BAD_POOL_CALLER bu anlama gelir; işlem parçacığı yani threadler, erişmemesi gereken veri havuzuna erişmeye çalışıyordur.
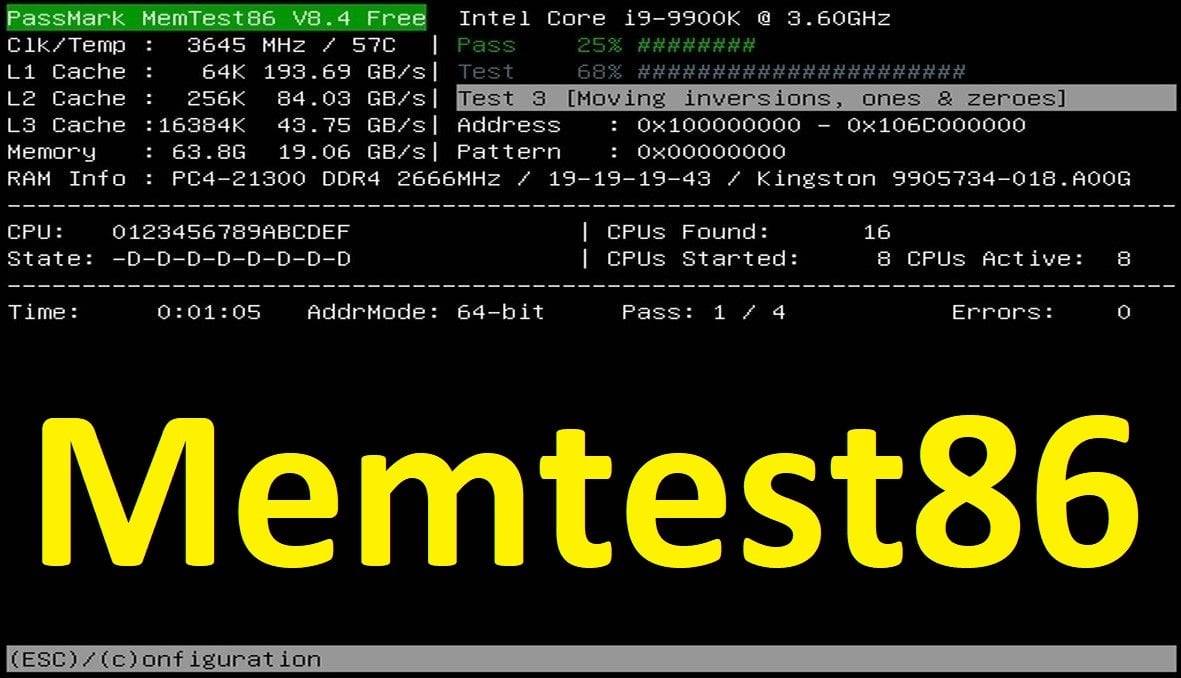
RAM belleklere uygulanan herhangi bir hız aşırtma işlemi varsa kaldırınız. XMP veya DOCP özelliği açılabiliyorsa devre dışı bırakınız ve belleklerinizi MemTest86 ile taramadan geçiriniz.
Laptop modeliniz Victus 16-S0047NT olarak görünüyor, doğru mudur?
Ek olarak Bluetooth sürücünüzü güncelleyiniz.
NVIDIA ekran kartı sürücüsüne dair bileşenler görünüyor. Ancak çok kritik değil gibi, şimdilik işlem yapmamız gerekmiyor.
Alınan BAD_POOL_CALLER ve MEMORY_MANAGEMENT hataları bunu destekler nitelikte.
TPM ile bağlantısı var ancak TPM modülünden gelen bilgiler RAM bellekte yanlış yorumlanıyor, yanlış veri havuzunda işlenmeye çalışılıyor.
BAD_POOL_CALLER bu anlama gelir; işlem parçacığı yani threadler, erişmemesi gereken veri havuzuna erişmeye çalışıyordur.
RAM belleklere uygulanan herhangi bir hız aşırtma işlemi varsa kaldırınız. XMP veya DOCP özelliği açılabiliyorsa devre dışı bırakınız ve belleklerinizi MemTest86 ile taramadan geçiriniz.
Laptop modeliniz Victus 16-S0047NT olarak görünüyor, doğru mudur?
Ek olarak Bluetooth sürücünüzü güncelleyiniz.
NVIDIA ekran kartı sürücüsüne dair bileşenler görünüyor. Ancak çok kritik değil gibi, şimdilik işlem yapmamız gerekmiyor.
Ben hala TPM ile ilgili oldugu kanaatindeyim. BIOS uzerinden TPM devre disi birakilarak kimin hakli oldugu kolaylikla gorulebilir. Eger TPM devre disi birakildiginda BSOD'ler durur ise, ben hakliyim. Eger TPM devre disi birakildiginda BSOD'ler devam eder ise, siz haklisiniz.
 drive.google.com