[CODE title="çıktı"]_________________________________________________________________________________________________________
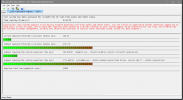
CONCLUSION
_________________________________________________________________________________________________________
Your system appears to be having trouble handling real-time audio and other tasks. You are likely to experience buffer underruns appearing as drop outs, clicks or pops. One or more DPC routines that belong to a driver running in your system appear to be executing for too long. One problem may be related to power management, disable CPU throttling settings in Control Panel and BIOS setup. Check for BIOS updates.
LatencyMon has been analyzing your system for 0:04:29 (h:mm:ss) on all processors.
_________________________________________________________________________________________________________
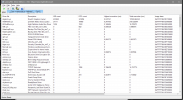
SYSTEM INFORMATION
_________________________________________________________________________________________________________
Computer name: SKY
OS version: Windows 10, 10.0, version 2009, build: 19042 (x64)
Hardware: B450M S2H, Gigabyte Technology Co., Ltd.
CPU: AuthenticAMD AMD Ryzen 5 3600X 6-Core Processor
Logical processors: 12
Processor groups: 1
RAM: 16326 MB total
_________________________________________________________________________________________________________
CPU SPEED
_________________________________________________________________________________________________________
Reported CPU speed: 3793 MHz
Note: reported execution times may be calculated based on a fixed reported CPU speed. Disable variable speed settings like Intel Speed Step and AMD Cool N Quiet in the BIOS setup for more accurate results.
_________________________________________________________________________________________________________
MEASURED INTERRUPT TO USER PROCESS LATENCIES
_________________________________________________________________________________________________________
The interrupt to process latency reflects the measured interval that a usermode process needed to respond to a hardware request from the moment the interrupt service routine started execution. This includes the scheduling and execution of a DPC routine, the signaling of an event and the waking up of a usermode thread from an idle wait state in response to that event.
Highest measured interrupt to process latency (µs): 2757,70
Average measured interrupt to process latency (µs): 5,007127
Highest measured interrupt to DPC latency (µs): 2753,90
Average measured interrupt to DPC latency (µs): 2,233461
_________________________________________________________________________________________________________
REPORTED ISRs
_________________________________________________________________________________________________________
Interrupt service routines are routines installed by the OS and device drivers that execute in response to a hardware interrupt signal.
Highest ISR routine execution time (µs): 285,926707
Driver with highest ISR routine execution time: dxgkrnl.sys - DirectX Graphics Kernel, Microsoft Corporation
Highest reported total ISR routine time (%): 0,303107
Driver with highest ISR total time: dxgkrnl.sys - DirectX Graphics Kernel, Microsoft Corporation
Total time spent in ISRs (%) 0,304145
ISR count (execution time <250 µs): 462547
ISR count (execution time 250-500 µs): 0
ISR count (execution time 500-1000 µs): 8
ISR count (execution time 1000-2000 µs): 0
ISR count (execution time 2000-4000 µs): 0
ISR count (execution time >=4000 µs): 0
_________________________________________________________________________________________________________
REPORTED DPCs
_________________________________________________________________________________________________________
DPC routines are part of the interrupt servicing dispatch mechanism and disable the possibility for a process to utilize the CPU while it is interrupted until the DPC has finished execution.
Highest DPC routine execution time (µs): 2771,695755
Driver with highest DPC routine execution time: nvlddmkm.sys - NVIDIA Windows Kernel Mode Driver, Version 466.77 , NVIDIA Corporation
Highest reported total DPC routine time (%): 0,230903
Driver with highest DPC total execution time: dxgkrnl.sys - DirectX Graphics Kernel, Microsoft Corporation
Total time spent in DPCs (%) 0,357253
DPC count (execution time <250 µs): 1392391
DPC count (execution time 250-500 µs): 0
DPC count (execution time 500-10000 µs): 1279
DPC count (execution time 1000-2000 µs): 13
DPC count (execution time 2000-4000 µs): 1
DPC count (execution time >=4000 µs): 0
_________________________________________________________________________________________________________
REPORTED HARD PAGEFAULTS
_________________________________________________________________________________________________________
Hard pagefaults are events that get triggered by making use of virtual memory that is not resident in RAM but backed by a memory mapped file on disk. The process of resolving the hard pagefault requires reading in the memory from disk while the process is interrupted and blocked from execution.
NOTE: some processes were hit by hard pagefaults. If these were programs producing audio, they are likely to interrupt the audio stream resulting in dropouts, clicks and pops. Check the Processes tab to see which programs were hit.
Process with highest pagefault count: uplaywebcore.exe
Total number of hard pagefaults 13804
Hard pagefault count of hardest hit process: 11156
Number of processes hit: 18
_________________________________________________________________________________________________________
PER CPU DATA
_________________________________________________________________________________________________________
CPU 0 Interrupt cycle time (s): 24,176436
CPU 0 ISR highest execution time (µs): 285,926707
CPU 0 ISR total execution time (s): 9,817061
CPU 0 ISR count: 452608
CPU 0 DPC highest execution time (µs): 2771,695755
CPU 0 DPC total execution time (s): 11,241056
CPU 0 DPC count: 1341745
_________________________________________________________________________________________________________
CPU 1 Interrupt cycle time (s): 1,533787
CPU 1 ISR highest execution time (µs): 8,645927
CPU 1 ISR total execution time (s): 0,000932
CPU 1 ISR count: 513
CPU 1 DPC highest execution time (µs): 403,863960
CPU 1 DPC total execution time (s): 0,010818
CPU 1 DPC count: 1122
_________________________________________________________________________________________________________
CPU 2 Interrupt cycle time (s): 1,888957
CPU 2 ISR highest execution time (µs): 8,776167
CPU 2 ISR total execution time (s): 0,001504
CPU 2 ISR count: 761
CPU 2 DPC highest execution time (µs): 209,485895
CPU 2 DPC total execution time (s): 0,036477
CPU 2 DPC count: 3645
_________________________________________________________________________________________________________
CPU 3 Interrupt cycle time (s): 1,23550
CPU 3 ISR highest execution time (µs): 11,040337
CPU 3 ISR total execution time (s): 0,000302
CPU 3 ISR count: 35
CPU 3 DPC highest execution time (µs): 403,242816
CPU 3 DPC total execution time (s): 0,002962
CPU 3 DPC count: 799
_________________________________________________________________________________________________________
CPU 4 Interrupt cycle time (s): 1,745714
CPU 4 ISR highest execution time (µs): 0,0
CPU 4 ISR total execution time (s): 0,0
CPU 4 ISR count: 0
CPU 4 DPC highest execution time (µs): 161,216979
CPU 4 DPC total execution time (s): 0,037756
CPU 4 DPC count: 9586
_________________________________________________________________________________________________________
CPU 5 Interrupt cycle time (s): 2,951978
CPU 5 ISR highest execution time (µs): 0,0
CPU 5 ISR total execution time (s): 0,0
CPU 5 ISR count: 0
CPU 5 DPC highest execution time (µs): 402,391247
CPU 5 DPC total execution time (s): 0,055182
CPU 5 DPC count: 9716
_________________________________________________________________________________________________________
CPU 6 Interrupt cycle time (s): 1,592436
CPU 6 ISR highest execution time (µs): 0,0
CPU 6 ISR total execution time (s): 0,0
CPU 6 ISR count: 0
CPU 6 DPC highest execution time (µs): 199,136831
CPU 6 DPC total execution time (s): 0,019427
CPU 6 DPC count: 2599
_________________________________________________________________________________________________________
CPU 7 Interrupt cycle time (s): 1,509387
CPU 7 ISR highest execution time (µs): 0,0
CPU 7 ISR total execution time (s): 0,0
CPU 7 ISR count: 0
CPU 7 DPC highest execution time (µs): 194,648563
CPU 7 DPC total execution time (s): 0,007736
CPU 7 DPC count: 2019
_________________________________________________________________________________________________________
CPU 8 Interrupt cycle time (s): 2,271720
CPU 8 ISR highest execution time (µs): 6,361719
CPU 8 ISR total execution time (s): 0,004154
CPU 8 ISR count: 6953
CPU 8 DPC highest execution time (µs): 197,173214
CPU 8 DPC total execution time (s): 0,057603
CPU 8 DPC count: 11279
_________________________________________________________________________________________________________
CPU 9 Interrupt cycle time (s): 1,601477
CPU 9 ISR highest execution time (µs): 1,292381
CPU 9 ISR total execution time (s): 0,000058
CPU 9 ISR count: 89
CPU 9 DPC highest execution time (µs): 26,639072
CPU 9 DPC total execution time (s): 0,001804
CPU 9 DPC count: 406
_________________________________________________________________________________________________________
CPU 10 Interrupt cycle time (s): 1,767833
CPU 10 ISR highest execution time (µs): 5,810704
CPU 10 ISR total execution time (s): 0,000327
CPU 10 ISR count: 438
CPU 10 DPC highest execution time (µs): 69,648299
CPU 10 DPC total execution time (s): 0,016102
CPU 10 DPC count: 2567
_________________________________________________________________________________________________________
CPU 11 Interrupt cycle time (s): 1,940702
CPU 11 ISR highest execution time (µs): 15,177959
CPU 11 ISR total execution time (s): 0,000863
CPU 11 ISR count: 1158
CPU 11 DPC highest execution time (µs): 196,732402
CPU 11 DPC total execution time (s): 0,053902
CPU 11 DPC count: 8201
_________________________________________________________________________________________________________[/CODE]
@Quarit[/ICODE]
") Bunu da deniyelim. 2 tane şey isteyeceğim senden. 1. Link'ini verdiğim paketi indir zip'ten çıkar ve kurulum yap paketi...Daha sonra CMD penceresini yönetici olarak çalıştırıp şu iki komutu tırnak işaretleri olmadan yazıp enter yap, bittikten sonra her ikisi de bilgisayarına reset at. Umarım bunlar işe yarar...
Bunu da deniyelim. 2 tane şey isteyeceğim senden. 1. Link'ini verdiğim paketi indir zip'ten çıkar ve kurulum yap paketi...Daha sonra CMD penceresini yönetici olarak çalıştırıp şu iki komutu tırnak işaretleri olmadan yazıp enter yap, bittikten sonra her ikisi de bilgisayarına reset at. Umarım bunlar işe yarar...