Ahmet Metin
Kilopat
- Katılım
- 29 Mayıs 2016
- Mesajlar
- 311
Daha fazla
- Cinsiyet
- Erkek
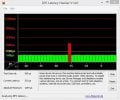
Arkadaşlar merhabalar, 1 yıla yakındır şu konudaki sorunu yaşamaktayım. Yeni araştırmalarım sonucu sistem gecikmelerini ölçtüm. Sorunumun adı sanırım "Micro stuttering" denilen illet. Latencymon programında sanırım bir hata bulundu, kırmızı renkte uyarı var. Diğer program hakkında bir bilgim yok ama sanırım sorun çıkmadı. Anlayan arkadaşlar lütfen bana fikir verebilir mi? Teşekkür ederim.
Kod:
_________________________________________________________________________________________________________.
CONCLUSION.
_________________________________________________________________________________________________________.
Your system appears to be having trouble handling real-time audio and other tasks. You are likely to experience buffer underruns appearing as drop outs, clicks or pops. One problem may be related to power management, disable CPU throttling settings in Control Panel and BIOS setup. Check for BIOS updates.
LatencyMon has been analyzing your system for 0:16:40 (h:mm:ss) on all processors.
_________________________________________________________________________________________________________.
SYSTEM INFORMATION.
_________________________________________________________________________________________________________.
Computer name: METO.
OS version: Windows 8.1, 6.3, build: 9600 (x64)
Hardware: All Series, ASUS.
CPU: GenuineIntel Intel(R) Core(TM) i7-4790 CPU @ 3.60GHz.
Logical processors: 8.
Processor groups: 1.
RAM: 8130 MB total.
_________________________________________________________________________________________________________.
CPU SPEED.
_________________________________________________________________________________________________________.
Reported CPU speed: 360 MHz.
Note: reported execution times may be calculated based on a fixed reported CPU speed. Disable variable speed settings like Intel Speed Step and AMD Cool N Quiet in the BIOS setup for more accurate results.
_________________________________________________________________________________________________________.
MEASURED INTERRUPT TO USER PROCESS LATENCIES.
_________________________________________________________________________________________________________.
The interrupt to process latency reflects the measured interval that a usermode process needed to respond to a hardware request from the moment the interrupt service routine started execution. This includes the scheduling and execution of a DPC routine, the signaling of an event and the waking up of a usermode thread from an idle wait state in response to that event.
Highest measured interrupt to process latency (µs): 3270,038510.
Average measured interrupt to process latency (µs): 7,810976.
Highest measured interrupt to DPC latency (µs): 3243,359142.
Average measured interrupt to DPC latency (µs): 3,243853.
_________________________________________________________________________________________________________.
REPORTED ISRs.
_________________________________________________________________________________________________________.
Interrupt service routines are routines installed by the OS and device drivers that execute in response to a hardware interrupt signal.
Highest ISR routine execution time (µs): 118,548333.
Driver with highest ISR routine execution time: HDAudBus.sys - High Definition Audio Bus Driver, Microsoft Corporation.
Highest reported total ISR routine time (%): 0,067456.
Driver with highest ISR total time: dxgkrnl.sys - DirectX Graphics Kernel, Microsoft Corporation.
Total time spent in ISRs (%) 0,094752.
ISR count (execution time <250 µs): 1164153.
ISR count (execution time 250-500 µs): 0.
ISR count (execution time 500-1000 µs): 0.
ISR count (execution time 1000-2000 µs): 0.
ISR count (execution time 2000-4000 µs): 0.
ISR count (execution time >=4000 µs): 0.
_________________________________________________________________________________________________________.
REPORTED DPCs.
_________________________________________________________________________________________________________.
DPC routines are part of the interrupt servicing dispatch mechanism and disable the possibility for a process to utilize the CPU while it is interrupted until the DPC has finished execution.
Highest DPC routine execution time (µs): 407,71750.
Driver with highest DPC routine execution time: Wdf01000.sys - Çekirdek Modu Sürücü Çatısı Çalıştırma Zamanı, Microsoft Corporation.
Highest reported total DPC routine time (%): 0,074503.
Driver with highest DPC total execution time: rspLLL64.sys - Resplendence Latency Monitoring and Auxiliary Kernel Library, Resplendence Software Projects Sp.
Total time spent in DPCs (%) 0,217988.
DPC count (execution time <250 µs): 5977615.
DPC count (execution time 250-500 µs): 0.
DPC count (execution time 500-10000 µs): 2.
DPC count (execution time 1000-2000 µs): 0.
DPC count (execution time 2000-4000 µs): 0.
DPC count (execution time >=4000 µs): 0.
_________________________________________________________________________________________________________.
REPORTED HARD PAGEFAULTS.
_________________________________________________________________________________________________________.
Hard pagefaults are events that get triggered by making use of virtual memory that is not resident in RAM but backed by a memory mapped file on disk. The process of resolving the hard pagefault requires reading in the memory from disk while the process is interrupted and blocked from execution.
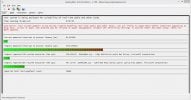
NOTE: some processes were hit by hard pagefaults. If these were programs producing audio, they are likely to interrupt the audio stream resulting in dropouts, clicks and pops. Check the Processes tab to see which programs were hit.
Process with highest pagefault count: explorer.exe.
Total number of hard pagefaults 22855.
Hard pagefault count of hardest hit process: 10891.
Number of processes hit: 51.
_________________________________________________________________________________________________________.
PER CPU DATA.
_________________________________________________________________________________________________________.
CPU 0 Interrupt cycle time (s): 73,202986.
CPU 0 ISR highest execution time (µs): 118,548333.
CPU 0 ISR total execution time (s): 7,582065.
CPU 0 ISR count: 1164153.
CPU 0 DPC highest execution time (µs): 407,71750.
CPU 0 DPC total execution time (s): 16,938011.
CPU 0 DPC count: 5667354.
_________________________________________________________________________________________________________.
CPU 1 Interrupt cycle time (s): 37,065244.
CPU 1 ISR highest execution time (µs): 0,0.
CPU 1 ISR total execution time (s): 0,0.
CPU 1 ISR count: 0.
CPU 1 DPC highest execution time (µs): 54,495833.
CPU 1 DPC total execution time (s): 0,039334.
CPU 1 DPC count: 38713.
_________________________________________________________________________________________________________.
CPU 2 Interrupt cycle time (s): 15,870752.
CPU 2 ISR highest execution time (µs): 0,0.
CPU 2 ISR total execution time (s): 0,0.
CPU 2 ISR count: 0.
CPU 2 DPC highest execution time (µs): 110,076667.
CPU 2 DPC total execution time (s): 0,089974.
CPU 2 DPC count: 52443.
_________________________________________________________________________________________________________.
CPU 3 Interrupt cycle time (s): 25,188071.
CPU 3 ISR highest execution time (µs): 0,0.
CPU 3 ISR total execution time (s): 0,0.
CPU 3 ISR count: 0.
CPU 3 DPC highest execution time (µs): 70,99750.
CPU 3 DPC total execution time (s): 0,031175.
CPU 3 DPC count: 33459.
_________________________________________________________________________________________________________.
CPU 4 Interrupt cycle time (s): 14,675761.
CPU 4 ISR highest execution time (µs): 0,0.
CPU 4 ISR total execution time (s): 0,0.
CPU 4 ISR count: 0.
CPU 4 DPC highest execution time (µs): 200,61250.
CPU 4 DPC total execution time (s): 0,117668.
CPU 4 DPC count: 57024.
_________________________________________________________________________________________________________.
CPU 5 Interrupt cycle time (s): 26,756631.
CPU 5 ISR highest execution time (µs): 0,0.
CPU 5 ISR total execution time (s): 0,0.
CPU 5 ISR count: 0.
CPU 5 DPC highest execution time (µs): 134,656667.
CPU 5 DPC total execution time (s): 0,040038.
CPU 5 DPC count: 33377.
_________________________________________________________________________________________________________.
CPU 6 Interrupt cycle time (s): 20,618176.
CPU 6 ISR highest execution time (µs): 0,0.
CPU 6 ISR total execution time (s): 0,0.
CPU 6 ISR count: 0.
CPU 6 DPC highest execution time (µs): 199,41250.
CPU 6 DPC total execution time (s): 0,087394.
CPU 6 DPC count: 46931.
_________________________________________________________________________________________________________.
CPU 7 Interrupt cycle time (s): 33,103956.
CPU 7 ISR highest execution time (µs): 0,0.
CPU 7 ISR total execution time (s): 0,0.
CPU 7 ISR count: 0.
CPU 7 DPC highest execution time (µs): 111,596667.
CPU 7 DPC total execution time (s): 0,099796.
CPU 7 DPC count: 48316.
_________________________________________________________________________________________________________.Dosya Ekleri
Son düzenleyen: Moderatör: