R3 2200G GTX 960 Valorant oynarken mavi ekran hatası

İşletim sistemi
Windows 10

mitzenn

Femtopat
Katılım
2 Şubat 2024
Mesajlar
6
Daha fazla  
Cinsiyet
Erkek
RAM
16GB 3200MHz XPG Gammix CL16
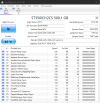
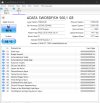
SSD veya HDD modeli
Adata Swordfish 500GB M2 NVMe SSD ve Seagate 500GB
Ekran kartı
ASUS GTX 960
Anakart
ASrock B450M-HDV R4.0
İşlemci
AMD Ryzen 3 2200G
Valorant oynarken bir anda mavi ekran hatası aldım. CMD'den SFC /scannow ve DISM.exe /online /cleanup-image /restorehealth komutlarını çalıştırdım ve bozuk birkaç dosya bulup düzeltti. Ekran kartı sürücüm güncel. Windows güncel. Minidump dosyasını aşağıya bırakıyorum. Şimdiden yardımlarınız için teşekkürler.


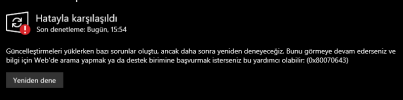
Ekstra Windows Debugging Tool'u açtığımda bir hata bulundu dedi ve bunu açtı.


Kod:
************* Preparing the environment for Debugger Extensions Gallery repositories **************
   ExtensionRepository : Implicit
   UseExperimentalFeatureForNugetShare : true
   AllowNugetExeUpdate : true
   NonInteractiveNuget : true
   AllowNugetMSCredentialProviderInstall : true
   AllowParallelInitializationOfLocalRepositories : true

   EnableRedirectToV8JsProvider : false

   -- Configuring repositories
      ----> Repository : LocalInstalled, Enabled: true
      ----> Repository : UserExtensions, Enabled: true

>>>>>>>>>>>>> Preparing the environment for Debugger Extensions Gallery repositories completed, duration 0.000 seconds

************* Waiting for Debugger Extensions Gallery to Initialize **************

>>>>>>>>>>>>> Waiting for Debugger Extensions Gallery to Initialize completed, duration 0.031 seconds
   ----> Repository : UserExtensions, Enabled: true, Packages count: 0
   ----> Repository : LocalInstalled, Enabled: true, Packages count: 41

Microsoft (R) Windows Debugger Version 10.0.27553.1004 AMD64
Copyright (c) Microsoft Corporation. All rights reserved.


Loading Dump File [C:\Windows\MEMORY.DMP]
Kernel Bitmap Dump File: Kernel address space is available, User address space may not be available.


************* Path validation summary **************
Response                         Time (ms)     Location
Deferred                                       srv*
Symbol search path is: srv*
Executable search path is:
Windows 10 Kernel Version 19041 MP (4 procs) Free x64
Product: WinNt, suite: TerminalServer SingleUserTS
Edition build lab: 19041.1.amd64fre.vb_release.191206-1406
Kernel base = 0xfffff800`82a00000 PsLoadedModuleList = 0xfffff800`8362a730
Debug session time: Sun Mar 17 10:59:39.779 2024 (UTC + 3:00)
System Uptime: 0 days 0:05:53.500
Loading Kernel Symbols
...............................................................
................................................................
..............................................................
Loading User Symbols
PEB is paged out (Peb.Ldr = 00000000`00713018).  Type ".hh dbgerr001" for details
Loading unloaded module list
........
For analysis of this file, run !analyze -v
nt!KeBugCheckEx:
fffff800`82dfd890 48894c2408      mov     qword ptr [rsp+8],rcx ss:0018:fffff800`85d02c90=0000000000000101
0: kd> !analyze -v
*******************************************************************************
*                                                                             *
*                        Bugcheck Analysis                                    *
*                                                                             *
*******************************************************************************

CLOCK_WATCHDOG_TIMEOUT (101)
An expected clock interrupt was not received on a secondary processor in an
MP system within the allocated interval. This indicates that the specified
processor is hung and not processing interrupts.
Arguments:
Arg1: 0000000000000030, Clock interrupt time out interval in nominal clock ticks.
Arg2: 0000000000000000, 0.
Arg3: ffffb080c0be9180, The PRCB address of the hung processor.
Arg4: 0000000000000001, The index of the hung processor.

Debugging Details:
------------------


KEY_VALUES_STRING: 1

    Key  : Analysis.CPU.mSec
    Value: 3031

    Key  : Analysis.Elapsed.mSec
    Value: 3138

    Key  : Analysis.IO.Other.Mb
    Value: 0

    Key  : Analysis.IO.Read.Mb
    Value: 0

    Key  : Analysis.IO.Write.Mb
    Value: 0

    Key  : Analysis.Init.CPU.mSec
    Value: 1186

    Key  : Analysis.Init.Elapsed.mSec
    Value: 7737

    Key  : Analysis.Memory.CommitPeak.Mb
    Value: 93

    Key  : Bugcheck.Code.KiBugCheckData
    Value: 0x101

    Key  : Bugcheck.Code.LegacyAPI
    Value: 0x101

    Key  : Bugcheck.Code.TargetModel
    Value: 0x101

    Key  : Failure.Bucket
    Value: CLOCK_WATCHDOG_TIMEOUT_INVALID_CONTEXT_nt!KeAccumulateTicks

    Key  : Failure.Hash
    Value: {95498f51-33a9-903b-59e5-d236937d8ecf}

    Key  : Hypervisor.Enlightenments.Value
    Value: 77057948

    Key  : Hypervisor.Enlightenments.ValueHex
    Value: 497cf9c

    Key  : Hypervisor.Flags.AnyHypervisorPresent
    Value: 1

    Key  : Hypervisor.Flags.ApicEnlightened
    Value: 1

    Key  : Hypervisor.Flags.ApicVirtualizationAvailable
    Value: 0

    Key  : Hypervisor.Flags.AsyncMemoryHint
    Value: 0

    Key  : Hypervisor.Flags.CoreSchedulerRequested
    Value: 0

    Key  : Hypervisor.Flags.CpuManager
    Value: 1

    Key  : Hypervisor.Flags.DeprecateAutoEoi
    Value: 0

    Key  : Hypervisor.Flags.DynamicCpuDisabled
    Value: 1

    Key  : Hypervisor.Flags.Epf
    Value: 0

    Key  : Hypervisor.Flags.ExtendedProcessorMasks
    Value: 1

    Key  : Hypervisor.Flags.HardwareMbecAvailable
    Value: 0

    Key  : Hypervisor.Flags.MaxBankNumber
    Value: 0

    Key  : Hypervisor.Flags.MemoryZeroingControl
    Value: 0

    Key  : Hypervisor.Flags.NoExtendedRangeFlush
    Value: 0

    Key  : Hypervisor.Flags.NoNonArchCoreSharing
    Value: 1

    Key  : Hypervisor.Flags.Phase0InitDone
    Value: 1

    Key  : Hypervisor.Flags.PowerSchedulerQos
    Value: 0

    Key  : Hypervisor.Flags.RootScheduler
    Value: 0

    Key  : Hypervisor.Flags.SynicAvailable
    Value: 1

    Key  : Hypervisor.Flags.UseQpcBias
    Value: 0

    Key  : Hypervisor.Flags.Value
    Value: 4722927

    Key  : Hypervisor.Flags.ValueHex
    Value: 4810ef

    Key  : Hypervisor.Flags.VpAssistPage
    Value: 1

    Key  : Hypervisor.Flags.VsmAvailable
    Value: 1

    Key  : Hypervisor.RootFlags.AccessStats
    Value: 1

    Key  : Hypervisor.RootFlags.CrashdumpEnlightened
    Value: 1

    Key  : Hypervisor.RootFlags.CreateVirtualProcessor
    Value: 1

    Key  : Hypervisor.RootFlags.DisableHyperthreading
    Value: 0

    Key  : Hypervisor.RootFlags.HostTimelineSync
    Value: 1

    Key  : Hypervisor.RootFlags.HypervisorDebuggingEnabled
    Value: 0

    Key  : Hypervisor.RootFlags.IsHyperV
    Value: 1

    Key  : Hypervisor.RootFlags.LivedumpEnlightened
    Value: 1

    Key  : Hypervisor.RootFlags.MapDeviceInterrupt
    Value: 1

    Key  : Hypervisor.RootFlags.MceEnlightened
    Value: 1

    Key  : Hypervisor.RootFlags.Nested
    Value: 0

    Key  : Hypervisor.RootFlags.StartLogicalProcessor
    Value: 1

    Key  : Hypervisor.RootFlags.Value
    Value: 1015

    Key  : Hypervisor.RootFlags.ValueHex
    Value: 3f7

    Key  : SecureKernel.HalpHvciEnabled
    Value: 0

    Key  : WER.OS.Branch
    Value: vb_release

    Key  : WER.OS.Version
    Value: 10.0.19041.1


BUGCHECK_CODE:  101

BUGCHECK_P1: 30

BUGCHECK_P2: 0

BUGCHECK_P3: ffffb080c0be9180

BUGCHECK_P4: 1

FILE_IN_CAB:  MEMORY.DMP

FAULTING_PROCESSOR: 1

PROCESS_NAME:  VALORANT-Win64-Shipping.exe

BLACKBOXBSD: 1 (!blackboxbsd)


BLACKBOXNTFS: 1 (!blackboxntfs)


BLACKBOXPNP: 1 (!blackboxpnp)


BLACKBOXWINLOGON: 1

STACK_TEXT: 
fffff800`85d02c88 fffff800`82e37c86     : 00000000`00000101 00000000`00000030 00000000`00000000 ffffb080`c0be9180 : nt!KeBugCheckEx
fffff800`85d02c90 fffff800`82c5937d     : 00000000`00000000 fffff800`7d810180 00000000`00000246 00000000`00005860 : nt!KeAccumulateTicks+0x1e1b26
fffff800`85d02cf0 fffff800`82c518d1     : 00000000`00005800 00000000`000034ac fffff800`7d810180 00000000`00000001 : nt!KiUpdateRunTime+0x5d
fffff800`85d02d40 fffff800`82c53793     : ffff8281`b0dddf50 00000000`00000000 fffff800`83631a40 00000000`00000000 : nt!KiUpdateTime+0x4a1
fffff800`85d02e80 fffff800`82c509a2     : ffff8281`b0dddf50 ffff8281`b0dddfd0 ffff8281`b0dddf00 00000000`0000000c : nt!KeClockInterruptNotify+0x2e3
fffff800`85d02f30 fffff800`82d00805     : 00000000`d2b6f02a fffff800`836f3ae0 fffff800`836f3b90 00000000`00000000 : nt!HalpTimerClockInterrupt+0xe2
fffff800`85d02f60 fffff800`82dff8ca     : ffff8281`b0dddfd0 fffff800`836f3ae0 00000000`00000001 00000000`00000000 : nt!KiCallInterruptServiceRoutine+0xa5
fffff800`85d02fb0 fffff800`82e000f7     : 00000000`00000000 fffff800`8372f178 ffffb080`c0bf4078 fffff800`82c4f35a : nt!KiInterruptSubDispatchNoLockNoEtw+0xfa
ffff8281`b0dddf50 fffff800`82cb9101     : ffff8281`b0dde128 ffff8281`b0dde120 00000000`00000000 00000000`00000000 : nt!KiInterruptDispatchNoLockNoEtw+0x37
ffff8281`b0dde0e0 fffff800`83046f63     : 00000000`00000000 ffff8281`b0ddeb80 00000000`00000001 00000000`00000001 : nt!KeFlushProcessWriteBuffers+0xb5
ffff8281`b0dde120 fffff800`8300ffb7     : 00000000`00000000 00000000`00010400 00000000`00000000 00000000`00000000 : nt!ExpGetProcessInformation+0x183
ffff8281`b0dde780 fffff800`8300f167     : 00000000`00000f34 ffff9960`00501802 00000000`00000005 00000000`114f3120 : nt!ExpQuerySystemInformation+0xd07
ffff8281`b0ddeac0 fffff800`82e11d77     : ffff9b88`6d1c0000 fffff800`836fc410 ffff8281`b0ddeb80 ffff9b88`6d721390 : nt!NtQuerySystemInformation+0x37
ffff8281`b0ddeb00 00007ff8`794cd6a4     : 00000000`00000000 00000000`00000000 00000000`00000000 00000000`00000000 : nt!KiSystemServiceExitPico+0x41d
00000000`1432e158 00000000`00000000     : 00000000`00000000 00000000`00000000 00000000`00000000 00000000`00000000 : 0x00007ff8`794cd6a4


SYMBOL_NAME:  nt!KeAccumulateTicks+1e1b26

MODULE_NAME: nt

IMAGE_NAME:  ntkrnlmp.exe

STACK_COMMAND:  .cxr; .ecxr ; kb

BUCKET_ID_FUNC_OFFSET:  1e1b26

FAILURE_BUCKET_ID:  CLOCK_WATCHDOG_TIMEOUT_INVALID_CONTEXT_nt!KeAccumulateTicks

OS_VERSION:  10.0.19041.1

BUILDLAB_STR:  vb_release

OSPLATFORM_TYPE:  x64

OSNAME:  Windows 10

FAILURE_ID_HASH:  {95498f51-33a9-903b-59e5-d236937d8ecf}

Followup:     MachineOwner
---------

0: kd> lmvm nt
Browse full module list
start             end                 module name
fffff800`82a00000 fffff800`83a46000   nt         (pdb symbols)          C:\ProgramData\Dbg\sym\ntkrnlmp.pdb\3A3DF78E73ED8201D671C995F240BCDC1\ntkrnlmp.pdb
    Loaded symbol image file: ntkrnlmp.exe
    Mapped memory image file: C:\ProgramData\Dbg\sym\ntkrnlmp.exe\3E4EF1D41046000\ntkrnlmp.exe
    Image path: ntkrnlmp.exe
    Image name: ntkrnlmp.exe
    Browse all global symbols  functions  data
    Image was built with /Brepro flag.
    Timestamp:        3E4EF1D4 (This is a reproducible build file hash, not a timestamp)
    CheckSum:         00A64E43
    ImageSize:        01046000
    Translations:     0000.04b0 0000.04e4 0409.04b0 0409.04e4
    Information from resource tables:
 
Son düzenleme:
Rich (BB code):
CLOCK_WATCHDOG_TIMEOUT (101)
An expected clock interrupt was not received on a secondary processor in an
MP system within the allocated interval. This indicates that the specified
processor is hung and not processing interrupts.
Arguments:
Arg1: 0000000000000030, Clock interrupt time out interval in nominal clock ticks.
Arg2: 0000000000000000, 0.
Arg3: ffffb080c0be9180, The PRCB address of the hung processor.
Arg4: 0000000000000001, The index of the hung processor.

Rich (BB code):
kd> !prcb 1
PRCB for Processor 1 at ffffb080c0be9180:
Current IRQL -- 0
Threads-- Current ffff9b886826c080 Next ffff9b886856f080 Idle ffffb080c0bf4140
Processor Index 1 Number (0, 1) GroupSetMember 2
Interrupt Count -- 0015fda2
Times -- Dpc 000000f0 Interrupt 00000061
 Kernel 00003b58 User 00001afe

Aldığın hata %90 işlemci kaynaklıdır ki öyle büyük ihtimalle. İşlemcinin 1. bloğunda çökme yaşanmış.

Rich (BB code):
kd> r if
if=1

İşlemci çökmelere yanıt verebilecek durumda iken bile yanıt vermemiş. Bu durumda daha çok işlemci tarafına yoğunlaşabiliriz.

Rich (BB code):
kd> !dpcs
CPU Type KDPC Function
Failed to read DPC at 0xfffff80083620ec0
 1: Normal : 0xffffb080c0bf1290 0xfffff80082c525e0 nt!PpmPerfAction

Rich (BB code):
kd> k
 # Child-SP RetAddr Call Site
00 fffff800`85d02c88 fffff800`82e37c86 nt!KeBugCheckEx
01 fffff800`85d02c90 fffff800`82c5937d nt!KeAccumulateTicks+0x1e1b26
02 fffff800`85d02cf0 fffff800`82c518d1 nt!KiUpdateRunTime+0x5d
03 fffff800`85d02d40 fffff800`82c53793 nt!KiUpdateTime+0x4a1
04 fffff800`85d02e80 fffff800`82c509a2 nt!KeClockInterruptNotify+0x2e3
05 fffff800`85d02f30 fffff800`82d00805 nt!HalpTimerClockInterrupt+0xe2
06 fffff800`85d02f60 fffff800`82dff8ca nt!KiCallInterruptServiceRoutine+0xa5
07 fffff800`85d02fb0 fffff800`82e000f7 nt!KiInterruptSubDispatchNoLockNoEtw+0xfa
08 ffff8281`b0dddf50 00000000`00000000 nt!KiInterruptDispatchNoLockNoEtw+0x37

Çoğunlukla ben durumda işlemciye herhangi bir OC yapılmış mı diye bakarım. Yapılmış herhalde.

Rich (BB code):
Processor Version AMD Ryzen 3 2200G with Radeon Vega Graphics
 Processor Voltage 8eh - 1.4V
 External Clock 100MHz
 Max Speed 3700MHz
 Current Speed 3750MHz

İşlemciye yapılan overclock işlemini geri çek. Donanımsal sorun olduğunu sanmıyorum fakat sen yine de olay logları yönetim olayları kısmını da paylaş.

* Rehber Olay Görüntüleyicisi Raporu Almak

Ayrıca olaylara NVIDIA sürücün de karışmış. Güncel olduğu için yapılacak pek bir şey yok. Fakat istersen silip tekrar yükleyebilirsin.

Rich (BB code):
 kd> k= fffff
 # Child-SP RetAddr Call Site
00 fffff800`85d02c88 fffff800`82e37c86 nt!KeBugCheckEx
01 fffff800`85d02c90 fffff800`82c5937d nt!KeAccumulateTicks+0x1e1b26
02 fffff800`85d02cf0 fffff800`82c518d1 nt!KiUpdateRunTime+0x5d
Unable to load image \SystemRoot\System32\DriverStore\FileRepository\nv_dispi.inf_amd64_618b150331c5f4ad\nvlddmkm.sys, Win32 error 0n2
*** WARNING: Unable to verify timestamp for nvlddmkm.sys
03 fffff800`85d02d40 fffff800`82c53793 nt!KiUpdateTime+0x4a1
 fffff800`85d02d68 fffff800`a1807a2e  nvlddmkm+0xb77a2e
04 fffff800`85d02e80 fffff800`82c509a2 nt!KeClockInterruptNotify+0x2e3
05 fffff800`85d02f30 fffff800`82d00805 nt!HalpTimerClockInterrupt+0xe2
06 fffff800`85d02f60 fffff800`82dff8ca nt!KiCallInterruptServiceRoutine+0xa5
07 fffff800`85d02fb0 fffff800`82e000f7 nt!KiInterruptSubDispatchNoLockNoEtw+0xfa
08 ffff8281`b0dddf50 00000000`00000000 nt!KiInterruptDispatchNoLockNoEtw+0x37

kd> lmvm nvlddmkm
Browse full module list
start end module name
fffff800`a0c90000 fffff800`a46e6000 nvlddmkm T (no symbols)
 Loaded symbol image file: nvlddmkm.sys
 Image path: \SystemRoot\System32\DriverStore\FileRepository\nv_dispi.inf_amd64_618b150331c5f4ad\nvlddmkm.sys
 Image name: nvlddmkm.sys
 Browse all global symbols functions data
 Timestamp:  Fri Mar 1 20:55:35 2024 (65E21697)
 CheckSum: 0393217E
 ImageSize: 03A56000
 Translations: 0000.04b0 0000.04e4 0409.04b0 0409.04e4
 Information from resource tables:
 
Rich (BB code):
CLOCK_WATCHDOG_TIMEOUT (101)
An expected clock interrupt was not received on a secondary processor in an
MP system within the allocated interval. This indicates that the specified
processor is hung and not processing interrupts.
Arguments:
Arg1: 0000000000000030, Clock interrupt time out interval in nominal clock ticks.
Arg2: 0000000000000000, 0.
Arg3: ffffb080c0be9180, The PRCB address of the hung processor.
Arg4: 0000000000000001, The index of the hung processor.

Rich (BB code):
0: kd> !prcb 1
PRCB for Processor 1 at ffffb080c0be9180:
Current IRQL -- 0
Threads-- Current ffff9b886826c080 Next ffff9b886856f080 Idle ffffb080c0bf4140
Processor Index 1 Number (0, 1) GroupSetMember 2
Interrupt Count -- 0015fda2
Times -- Dpc 000000f0 Interrupt 00000061
 Kernel 00003b58 User 00001afe
İşlemcinin 2.çekirdekte çöktüğü bir gerçek. Bu yüzden bizi ilk çekirdek ilgilendirmiyor, ilk çekirdek normalinde olduğu gibi devam edecek kendi işini, yığınını oluşturacak ama dosyanın çökmesinin olduğu çekirdeği ilgilendirmeyecek.

İşlemci kesmelere yanıt vermiyor, Bu da zaten çökmenin nedenini açıklıyor. Olağanın uzağında bir durum yok. Gördüğün gibi ilk çekirdek normal kesme seviyesindeyken 2.çekirdek 0. Bu da 2.çekirdeğin CLOCK seviyesinde olduğunu gösteriyor.
Rich (BB code):
1: kd> r if
if=0
0: kd> !irql
Debugger saved IRQL for processor 0x0 -- 13
1: kd> !irql
Debugger saved IRQL for processor 0x1 -- 0 (LOW_LEVEL)

Buradaki hata Vanguard olarak gözüküyor lakin bu yeterli değil, disklerin bir olay bildirimi yapıyorlar. Bu olay bildiriminin içerği sonrası öncesi zaten Vanguard var. Emin olmak için disklerinin sağlık bilgilerini paylaşman gerekiyor.
Rich (BB code):
0: kd> k
 # Child-SP RetAddr Call Site
00 fffff800`85d02c88 fffff800`82e37c86 nt!KeBugCheckEx
01 ffff8281`ae645898 fffff800`82d8e18b nt!HalpHvCounterQueryCounter+0x1b
Unable to load image \??\C:\Program Files\Riot Vanguard\vgk.sys, Win32 error 0n2
*** WARNING: Unable to verify timestamp for vgk.sys
02 ffff8281`ae6421b0 fffff800`adaf6494 cldflt!HsmOsIsCbdTransacted+0x54
03 ffff8281`ae642388 fffff800`7ebd8dc8 FLTMGR!FltpCreateFileNameInformation+0x258
04 ffff8281`ae642448 fffff800`82c75d92 nt!MmCheckCachedPageStates+0x1e72
05 ffff8281`ae642668 fffff800`84cfdaa5  Ntfs!NtfsCheckFileRecord+0x155
06 ffff8281`ae642950 fffff800`adb0eda4 cldflt!TraceLoggingMetadataEnd+0x1882
07 ffff8281`ae642c08 fffff800`84a50b0d storport!StorEtwMiniportEvent+0x83d
08 ffff8281`ae642d58 fffff800`84d0644c Ntfs!LfsWrite+0x4ac
09 ffff8281`ae642dd8 fffff800`84d06713 Ntfs!LfsWriteLogRecordIntoLogPage+0x293
0a ffff8281`ae642f18 fffff800`84a38549 storport!StorEtwMiniportEventProxy+0x11d
0b ffff8281`ae642fa0 fffff800`84adf2a0 stornvme!`string'
0e ffff8281`ae642fb0 fffff800`84adf2c0 stornvme!`string'
0d ffff8281`ae643170 fffff800`84adf120 stornvme!`string'
0f ffff8281`ae643188 fffff800`84a0f296 storport!StorPortNotification+0xae6
10 ffff8281`ae643308 fffff800`933405b1 vgk+0x105b1
11 ffff8281`ae643a98 fffff800`933405b1 vgk+0x105b1
12 ffff8281`ae645708 fffff800`933405b1 vgk+0x105b1
13 fffff800`85d02cf0 fffff800`82c518d1 nt!KiUpdateRunTime+0x5d
14 fffff800`85d02d40 fffff800`82c53793 nt!KiUpdateTime+0x4a1
15 fffff800`85d02e80 fffff800`82c509a2 nt!KeClockInterruptNotify+0x2e3
16 fffff800`85d02f30 fffff800`82d00805 nt!HalpTimerClockInterrupt+0xe2
17 fffff800`85d02f60 fffff800`82dff8ca nt!KiCallInterruptServiceRoutine+0xa5
18 fffff800`85d02fb0 fffff800`82e000f7 nt!KiInterruptSubDispatchNoLockNoEtw+0xfa
19 ffff8281`b0dddf50 00000000`00000000 nt!KiInterruptDispatchNoLockNoEtw+0x37
 
Rich (BB code):
CLOCK_WATCHDOG_TIMEOUT (101)
An expected clock interrupt was not received on a secondary processor in an
MP system within the allocated interval. This indicates that the specified
processor is hung and not processing interrupts.
Arguments:
Arg1: 0000000000000030, Clock interrupt time out interval in nominal clock ticks.
Arg2: 0000000000000000, 0.
Arg3: ffffb080c0be9180, The PRCB address of the hung processor.
Arg4: 0000000000000001, The index of the hung processor.

Rich (BB code):
0: kd> !prcb 1
PRCB for Processor 1 at ffffb080c0be9180:
Current IRQL -- 0
Threads-- Current ffff9b886826c080 Next ffff9b886856f080 Idle ffffb080c0bf4140
Processor Index 1 Number (0, 1) GroupSetMember 2
Interrupt Count -- 0015fda2
Times -- Dpc 000000f0 Interrupt 00000061
 Kernel 00003b58 User 00001afe
İşlemcinin 2.çekirdekte çöktüğü bir gerçek. Bu yüzden bizi ilk çekirdek ilgilendirmiyor, ilk çekirdek normalinde olduğu gibi devam edecek kendi işini, yığınını oluşturacak ama dosyanın çökmesinin olduğu çekirdeği ilgilendirmeyecek.

İşlemci kesmelere yanıt vermiyor, Bu da zaten çökmenin nedenini açıklıyor. Olağanın uzağında bir durum yok. Gördüğün gibi ilk çekirdek normal kesme seviyesindeyken 2.çekirdek 0. Bu da 2.çekirdeğin CLOCK seviyesinde olduğunu gösteriyor.
Rich (BB code):
1: kd> r if
if=0
0: kd> !irql
Debugger saved IRQL for processor 0x0 -- 13
1: kd> !irql
Debugger saved IRQL for processor 0x1 -- 0 (LOW_LEVEL)

Buradaki hata Vanguard olarak gözüküyor lakin bu yeterli değil, disklerin bir olay bildirimi yapıyorlar. Bu olay bildiriminin içerği sonrası öncesi zaten Vanguard var. Emin olmak için disklerinin sağlık bilgilerini paylaşman gerekiyor.
Rich (BB code):
0: kd> k
 # Child-SP RetAddr Call Site
00 fffff800`85d02c88 fffff800`82e37c86 nt!KeBugCheckEx
01 ffff8281`ae645898 fffff800`82d8e18b nt!HalpHvCounterQueryCounter+0x1b
Unable to load image \??\C:\Program Files\Riot Vanguard\vgk.sys, Win32 error 0n2
*** WARNING: Unable to verify timestamp for vgk.sys
02 ffff8281`ae6421b0 fffff800`adaf6494 cldflt!HsmOsIsCbdTransacted+0x54
03 ffff8281`ae642388 fffff800`7ebd8dc8 FLTMGR!FltpCreateFileNameInformation+0x258
04 ffff8281`ae642448 fffff800`82c75d92 nt!MmCheckCachedPageStates+0x1e72
05 ffff8281`ae642668 fffff800`84cfdaa5  Ntfs!NtfsCheckFileRecord+0x155
06 ffff8281`ae642950 fffff800`adb0eda4 cldflt!TraceLoggingMetadataEnd+0x1882
07 ffff8281`ae642c08 fffff800`84a50b0d storport!StorEtwMiniportEvent+0x83d
08 ffff8281`ae642d58 fffff800`84d0644c Ntfs!LfsWrite+0x4ac
09 ffff8281`ae642dd8 fffff800`84d06713 Ntfs!LfsWriteLogRecordIntoLogPage+0x293
0a ffff8281`ae642f18 fffff800`84a38549 storport!StorEtwMiniportEventProxy+0x11d
0b ffff8281`ae642fa0 fffff800`84adf2a0 stornvme!`string'
0e ffff8281`ae642fb0 fffff800`84adf2c0 stornvme!`string'
0d ffff8281`ae643170 fffff800`84adf120 stornvme!`string'
0f ffff8281`ae643188 fffff800`84a0f296 storport!StorPortNotification+0xae6
10 ffff8281`ae643308 fffff800`933405b1 vgk+0x105b1
11 ffff8281`ae643a98 fffff800`933405b1 vgk+0x105b1
12 ffff8281`ae645708 fffff800`933405b1 vgk+0x105b1
13 fffff800`85d02cf0 fffff800`82c518d1 nt!KiUpdateRunTime+0x5d
14 fffff800`85d02d40 fffff800`82c53793 nt!KiUpdateTime+0x4a1
15 fffff800`85d02e80 fffff800`82c509a2 nt!KeClockInterruptNotify+0x2e3
16 fffff800`85d02f30 fffff800`82d00805 nt!HalpTimerClockInterrupt+0xe2
17 fffff800`85d02f60 fffff800`82dff8ca nt!KiCallInterruptServiceRoutine+0xa5
18 fffff800`85d02fb0 fffff800`82e000f7 nt!KiInterruptSubDispatchNoLockNoEtw+0xfa
19 ffff8281`b0dddf50 00000000`00000000 nt!KiInterruptDispatchNoLockNoEtw+0x37


Olay Dökümü:
 

Dosya Ekleri

  • hdd sağlık.png
    hdd sağlık.png
    62,1 KB · Görüntüleme: 7
  • ssd sağlık.png
    ssd sağlık.png
    54,3 KB · Görüntüleme: 8
Doğru bilginin adresine gelmişsin sayılır. Disk hataların da var. Büyük ihtimalle Seagate, her şeyin altından o çıkar çünkü...Eki Görüntüle 2143397

Kullandığım HDD sadece depolama amaçlı. Video olsun oyun kesitleri olsun vb. içinde oyun bile yüklü değil. İşlemci için Ryzen Master üzerinden OC yapmıştım eski haline getireceğim. Ama HDD için bir şey yapamam. Bunun dışında şöyle bir sorunum oluştu. Bunun sebebi bugün yaşananlar olabilir mi?
 

Dosya Ekleri

  • s.png
    s.png
    12,1 KB · Görüntüleme: 7

Geri
Yukarı