Erencikefe
Kilopat
- Katılım
- 1 Haziran 2018
- Mesajlar
- 122
Daha fazla
- Cinsiyet
- Erkek
- Meslek
- Veteriner
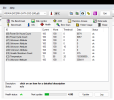
Bilgisayarım son aylarda ekranda sorun çıkarıp duruyordu. Genelde web browserlarda youtube'dan video izlerken falan ekranda beyaz beyaz kareler çıkıyordu, ekranı kaplayan umursamamıştım. Nioh 2 isimli bir oyunu oynarken son 2 gündür 30 dakika içinde art arda 7 kere PC'm çöktü. Çoğu zaman PC siyah ekran verdi oyun oynarken ama oyun oynamadan önce mavi ekran alıyordum ve DPC Watchdog Violation diye bir şey yazıyordu. Minidump isimli bir şey öğrendim, dün onları çıkarttım ve buraya da yazdım. Bilgisayardan resmen oyun oynanmıyor, bundan kurtulmanın bir yolu yok mudur? Ekran kartı falan mı bozuk? Yardım edebilirseniz sevinirim. Ekran kartım RTX 3060 Tİ.
Kod:
************* Preparing the environment for Debugger Extensions Gallery repositories **************
   ExtensionRepository : Implicit
   UseExperimentalFeatureForNugetShare : false
   AllowNugetExeUpdate : false
   AllowNugetMSCredentialProviderInstall : false
   AllowParallelInitializationOfLocalRepositories : true

   -- Configuring repositories
      ----> Repository : LocalInstalled, Enabled: true
      ----> Repository : UserExtensions, Enabled: true

>>>>>>>>>>>> Preparing the environment for Debugger Extensions Gallery repositories completed, duration 0.000 seconds


************* Waiting for Debugger Extensions Gallery to Initialize **************

>>>>>>>>>>>> Waiting for Debugger Extensions Gallery to Initialize completed, duration 0.047 seconds

   ----> Repository : UserExtensions, Enabled: true, Packages count: 0
   ----> Repository : LocalInstalled, Enabled: true, Packages count: 36

Microsoft (R) Windows Debugger Version 10.0.25877.1004 AMD64
Copyright (c) Microsoft Corporation. All rights reserved.


Loading Dump File [C:\Users\PC\Desktop\030324-6562-01.dmp]
Mini Kernel Dump File: Only registers and stack trace are available


************* Path validation summary **************
Response                         Time (ms)     Location
Deferred                                       srv*
Symbol search path is: srv*
Executable search path is:
Windows 10 Kernel Version 22621 MP (12 procs) Free x64
Product: WinNt, suite: TerminalServer SingleUserTS Personal
Kernel base = 0xfffff803`83600000 PsLoadedModuleList = 0xfffff803`84213550
Debug session time: Sun Mar  3 20:26:36.387 2024 (UTC + 3:00)
System Uptime: 1 days 2:35:10.063
Loading Kernel Symbols
...............................................................
................................................................
................................................................
....................
Loading User Symbols

Loading unloaded module list
..................................................
For analysis of this file, run !analyze -v
nt!KeBugCheckEx:
fffff803`83a16c30 48894c2408      mov     qword ptr [rsp+8],rcx ss:0018:ffffdd81`8cc579f0=0000000000000133
6: kd> !analyze -v
*******************************************************************************
*
Bugcheck Analysis                                    *
*

*******************************************************************************

DPC_WATCHDOG_VIOLATION (133)
The DPC watchdog detected a prolonged run time at an IRQL of DISPATCH_LEVEL
or above.
Arguments:
Arg1: 0000000000000000, A single DPC or ISR exceeded its time allotment. The offending
    component can usually be identified with a stack trace.
Arg2: 0000000000000501, The DPC time count (in ticks).
Arg3: 0000000000000500, The DPC time allotment (in ticks).
Arg4: fffff8038431c340, cast to nt!DPC_WATCHDOG_GLOBAL_TRIAGE_BLOCK, which contains
    additional information regarding this single DPC timeout

Debugging Details:
------------------

*************************************************************************
*                                                                   *
*                                                                   *
*    Either you specified an unqualified symbol, or your debugger   *
*    doesn't have full symbol information.  Unqualified symbol      *
*    resolution is turned off by default. Please either specify a   *
*    fully qualified symbol module!symbolname, or enable resolution *
*    of unqualified symbols by typing ".symopt- 100". Note that     *
*    enabling unqualified symbol resolution with network symbol     *
*    server shares in the symbol path may cause the debugger to     *
*    appear to hang for long periods of time when an incorrect      *
*    symbol name is typed or the network symbol server is down.     *
*                                                                   *
*    For some commands to work properly, your symbol path           *
*    must point to .pdb files that have full type information.      *
*                                                                   *
*    Certain .pdb files (such as the public OS symbols) do not      *
*    contain the required information.  Contact the group that      *
*    provided you with these symbols if you need this command to    *
*    work.                                                          *
*                                                                   *
*    Type referenced: TickPeriods                                   *
*                                                                   *
*************************************************************************

KEY_VALUES_STRING: 1

    Key  : Analysis.CPU.mSec
    Value: 2796

    Key  : Analysis.Elapsed.mSec
    Value: 3259

    Key  : Analysis.IO.Other.Mb
    Value: 0

    Key  : Analysis.IO.Read.Mb
    Value: 0

    Key  : Analysis.IO.Write.Mb
    Value: 0

    Key  : Analysis.Init.CPU.mSec
    Value: 234

    Key  : Analysis.Init.Elapsed.mSec
    Value: 91494

    Key  : Analysis.Memory.CommitPeak.Mb
    Value: 100

    Key  : Bugcheck.Code.LegacyAPI
    Value: 0x133

    Key  : Dump.Attributes.AsUlong
    Value: 1008

    Key  : Dump.Attributes.DiagDataWrittenToHeader
    Value: 1

    Key  : Dump.Attributes.ErrorCode
    Value: 0

    Key  : Dump.Attributes.KernelGeneratedTriageDump
    Value: 1

    Key  : Dump.Attributes.LastLine
    Value: Dump completed successfully.

    Key  : Dump.Attributes.ProgressPercentage
    Value: 0

    Key  : Failure.Bucket
    Value: 0x133_DPC_nt!KeAccumulateTicks

    Key  : Failure.Hash
    Value: {88dc98ce-f842-4daa-98d0-858621db6b0f}


BUGCHECK_CODE:  133

BUGCHECK_P1: 0

BUGCHECK_P2: 501

BUGCHECK_P3: 500

BUGCHECK_P4: fffff8038431c340

FILE_IN_CAB:  030324-6562-01.dmp

DUMP_FILE_ATTRIBUTES: 0x1008
  Kernel Generated Triage Dump

DPC_TIMEOUT_TYPE:  SINGLE_DPC_TIMEOUT_EXCEEDED

BLACKBOXBSD: 1 (!blackboxbsd)


BLACKBOXNTFS: 1 (!blackboxntfs)


BLACKBOXPNP: 1 (!blackboxpnp)


BLACKBOXWINLOGON: 1

CUSTOMER_CRASH_COUNT:  1

PROCESS_NAME:  System

FAULTING_THREAD:  000000000000000b

STACK_TEXT:
ffffdd81`8cc579e8 fffff803`83812d55     : 00000000`00000133 00000000`00000000 00000000`00000501 00000000`00000500 : nt!KeBugCheckEx
ffffdd81`8cc579f0 fffff803`83812421     : 0000fcd2`45d00915 00000000`005d7784 00000000`005d7783 00000000`00000000 : nt!KeAccumulateTicks+0x3d5
ffffdd81`8cc57a50 fffff803`8380fa2f     : 00000000`0000000c 00000000`00001388 00000000`005d7700 00000000`0037b5e9 : nt!KiUpdateRunTime+0xd1
ffffdd81`8cc57c00 fffff803`83810618     : 00000000`00000000 00000000`00000000 ffffdd81`8cbe8180 00000000`00000000 : nt!KiUpdateTime+0x63f
ffffdd81`8cc57ea0 fffff803`8380feda     : fffff803`8425fe80 00000000`00000001 00000000`00000001 00000000`00000002 : nt!KeClockInterruptNotify+0x228
ffffdd81`8cc57f40 fffff803`83924cdc     : 000000de`d7bc2602 ffffc987`1d938380 ffffc987`1d938430 ffffc987`1d8fa040 : nt!HalpTimerClockInterrupt+0x10a
ffffdd81`8cc57f70 fffff803`83a18dea     : ffff8288`51cbf1c0 ffffc987`1d938380 ffff8288`54517028 00000000`00000000 : nt!KiCallInterruptServiceRoutine+0x9c
ffffdd81`8cc57fb0 fffff803`83a19697     : ffffdd81`8ca00180 ffffdd81`8ca00180 00000000`80000000 fffff803`83a196a4 : nt!KiInterruptSubDispatchNoLockNoEtw+0xfa
ffff8288`51cbf140 fffff803`8386f9bc     : 00000000`00000010 00000000`00000a87 ffff8288`51cbf2f0 00000000`00000018 : nt!KiInterruptDispatchNoLockNoEtw+0x37
ffff8288`51cbf2d0 fffff803`8398de2f     : ffffc987`2f104080 fffff803`83867fb7 00000003`00000000 00000000`00000000 : nt!KeYieldProcessorEx+0x1c
ffff8288`51cbf300 fffff803`8387148c     : 00000000`00000000 00000000`1c9289aa ffffdd81`00000000 ffff8288`51cbf6b0 : nt!ExpGetPoolTagInfoTarget+0xff
ffff8288`51cbf350 fffff803`83872741     : 00000000`00000000 00000000`00000000 00000000`00000000 00000000`00000000 : nt!KiExecuteAllDpcs+0x42c
ffff8288`51cbf890 fffff803`83a1bb5e     : 00000000`00000000 ffffdd81`8cbe8180 ffffc987`1d9e9080 ffffc987`2244a500 : nt!KiRetireDpcList+0x1b1
ffff8288`51cbfb40 00000000`00000000     : ffff8288`51cc0000 ffff8288`51cb9000 00000000`00000000 00000000`00000000 : nt!KiIdleLoop+0x9e


STACK_COMMAND:  ~11 ; .cxr ; kb

SYMBOL_NAME:  nt!KeAccumulateTicks+3d5

MODULE_NAME: nt

IMAGE_NAME:  ntkrnlmp.exe

IMAGE_VERSION:  10.0.22621.3155

BUCKET_ID_FUNC_OFFSET:  3d5

FAILURE_BUCKET_ID:  0x133_DPC_nt!KeAccumulateTicks

OSPLATFORM_TYPE:  x64

OSNAME:  Windows 10

FAILURE_ID_HASH:  {88dc98ce-f842-4daa-98d0-858621db6b0f}

Followup:     MachineOwner
---------
Son düzenleyen: Moderatör: