Merhabalar,
Sistemi toplayalı 2 hafta oldu ancak 2 haftadır bu sorunu çözemedim. Bilgisayarım 3-4 saatte mutlaka 1 kere ve 1 saniyeliğine olmak üzere anlık donma yaşıyor ve seste beraberinde takılıyor. (metalimsi bir takılma sesi)
Latencymoon diye bir program ile hangi dosyada sıkıntı olduğunu öğrendim. Bir sürü foruma baktım yazılanları uyguladım fakat çözüm bulamadım. Driverları güvenli modda sildim tekrar yükledim, xmp kapattım, dedikleri bazı ayarları değiştirdim en sonunda format attım. Yine de olmadı. Tüm driverlar yüklü, BIOS son sürüm, chipset yüklü. Ses driverları ekran kartı ve anakart çakışıyordur belki diye sildim yine olmadı.
BIOS'un çipinde sorun olabilir mi? Eğer sorun donanımsal bir sorunsa anakartta mı problem var, öyleyse garantiye vereceğim. Yardım ederseniz sevinirim.
Sistemim: (Sadece SSD kullanıyorum)
MSI B450 Tomahawk Max
MSI RTX 2060 Super Gaming X
AMD Ryzen 5 3600
Cooler Master MB 511 RGB
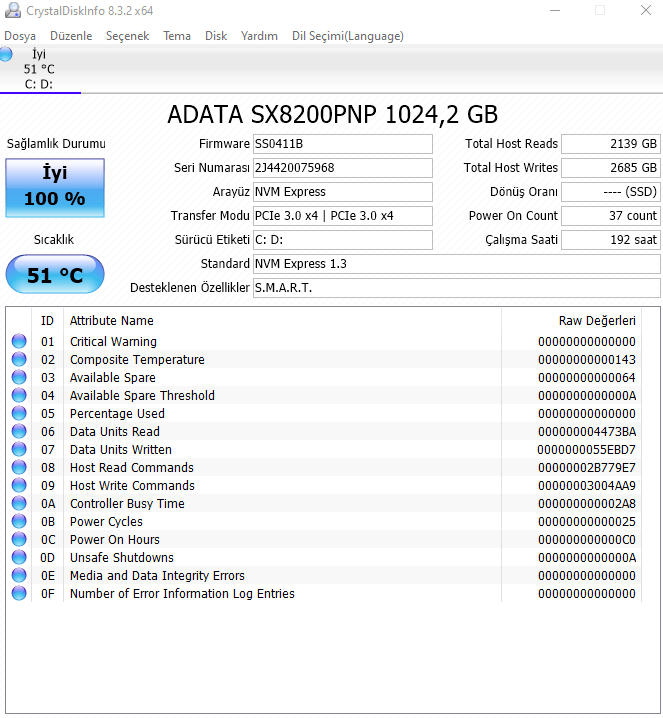
XPG 1TB SX8200 PRO M.2 SSD
Corsair Vengeance 2x8 GB RAM RGB 3200mhz
CORSAIR Hydro Serisi H100i RGB PLATINUM
Ek olarak işlemcim default ayarlarda 3.6gz ile 1.4v ile çalışıyor, sanırım bu volt değeri normale göre yüksekmiş. 1.2'ye çektim AMD Ryzen Master ile ancak yinede düzelmedi. Yapmamı istediğiniz bir test vs varsa yaparım.
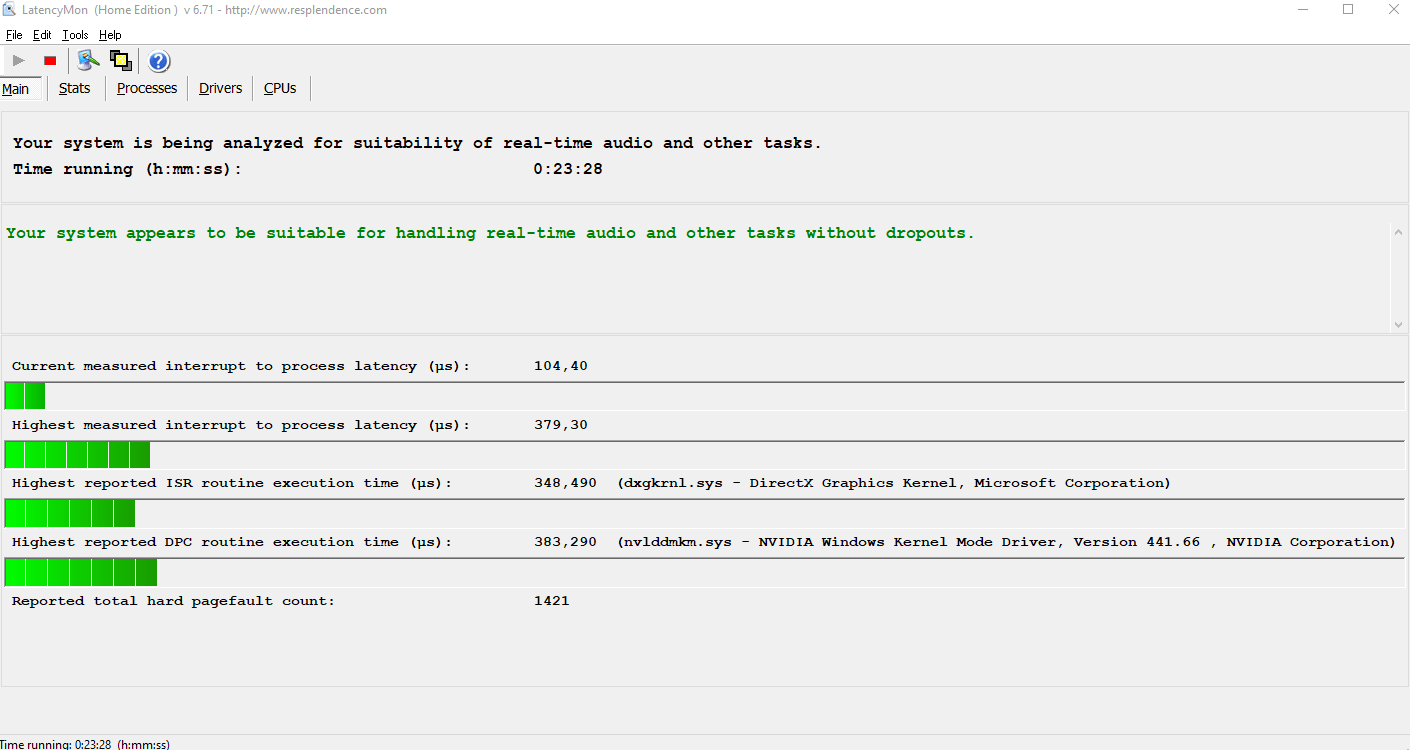
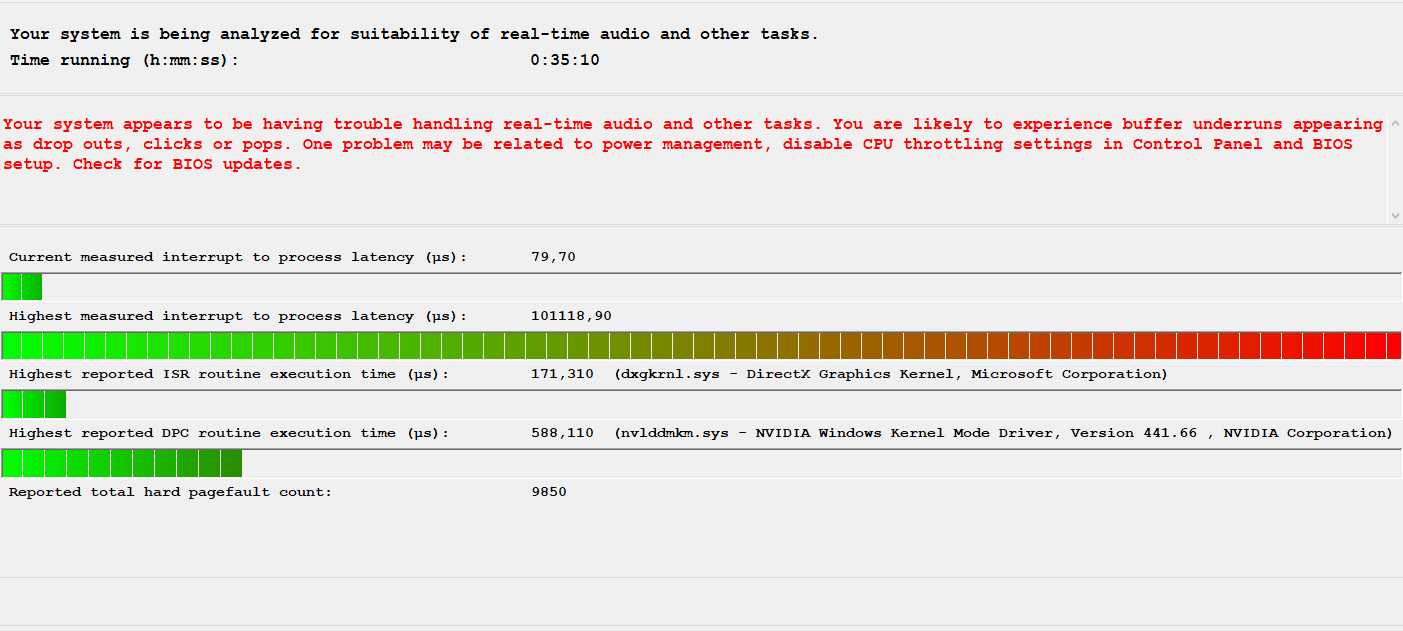
Bilgisayarı ilk açtığımdaki değerler bunlar ancak daha sonra birden 2. görseldeki hale geçiyor.


Storport.sys'de böyle 100 binlere çıkıyor.

CONCLUSION
_________________________________________________________________________________________________________
Your system appears to be having trouble handling real-time audio and other tasks. You are likely to experience buffer underruns appearing as drop outs, clicks or pops. One problem may be related to power management, disable CPU throttling settings in Control Panel and BIOS setup. Check for BIOS updates.
LatencyMon has been analyzing your system for 0:44:51 (h:mm:ss) on all processors.
_________________________________________________________________________________________________________
SYSTEM INFORMATION
_________________________________________________________________________________________________________
Computer name: DESKTOP-F13NCD9
OS version: Windows 10 , 10.0, build: 18363 (x64)
Hardware: MS-7C02, Micro-Star International Co., Ltd, B450 TOMAHAWK MAX (MS-7C02)
CPU: AuthenticAMD AMD Ryzen 5 3600 6-Core Processor
Logical processors: 12
Processor groups: 1
RAM: 16333 MB total
_________________________________________________________________________________________________________
CPU SPEED
_________________________________________________________________________________________________________
Reported CPU speed: 360 MHz
Note: reported execution times may be calculated based on a fixed reported CPU speed. Disable variable speed settings like Intel Speed Step and AMD Cool N Quiet in the BIOS setup for more accurate results.
WARNING: the CPU speed that was measured is only a fraction of the CPU speed reported. Your CPUs may be throttled back due to variable speed settings and thermal issues. It is suggested that you run a utility which reports your actual CPU frequency and temperature.
_________________________________________________________________________________________________________
MEASURED INTERRUPT TO USER PROCESS LATENCIES
_________________________________________________________________________________________________________
The interrupt to process latency reflects the measured interval that a usermode process needed to respond to a hardware request from the moment the interrupt service routine started execution. This includes the scheduling and execution of a DPC routine, the signaling of an event and the waking up of a usermode thread from an idle wait state in response to that event.
Highest measured interrupt to process latency (µs): 101118,90
Average measured interrupt to process latency (µs): 5,025299
Highest measured interrupt to DPC latency (µs): 101115,10
Average measured interrupt to DPC latency (µs): 1,859687
_________________________________________________________________________________________________________
REPORTED ISRs
_________________________________________________________________________________________________________
Interrupt service routines are routines installed by the OS and device drivers that execute in response to a hardware interrupt signal.
Highest ISR routine execution time (µs): 204,340
Driver with highest ISR routine execution time: dxgkrnl.sys - DirectX Graphics Kernel, Microsoft Corporation
Highest reported total ISR routine time (%): 0,188925
Driver with highest ISR total time: dxgkrnl.sys - DirectX Graphics Kernel, Microsoft Corporation
Total time spent in ISRs (%) 0,189555
ISR count (execution time <250 µs): 1933840
ISR count (execution time 250-500 µs): 0
ISR count (execution time 500-999 µs): 0
ISR count (execution time 1000-1999 µs): 0
ISR count (execution time 2000-3999 µs): 0
ISR count (execution time >=4000 µs): 0
_________________________________________________________________________________________________________
REPORTED DPCs
_________________________________________________________________________________________________________
DPC routines are part of the interrupt servicing dispatch mechanism and disable the possibility for a process to utilize the CPU while it is interrupted until the DPC has finished execution.
Highest DPC routine execution time (µs): 687,40
Driver with highest DPC routine execution time: nvlddmkm.sys - NVIDIA Windows Kernel Mode Driver, Version 441.66 , NVIDIA Corporation
Highest reported total DPC routine time (%): 0,075447
Driver with highest DPC total execution time: dxgkrnl.sys - DirectX Graphics Kernel, Microsoft Corporation
Total time spent in DPCs (%) 0,172038
DPC count (execution time <250 µs): 9257230
DPC count (execution time 250-500 µs): 0
DPC count (execution time 500-999 µs): 6
DPC count (execution time 1000-1999 µs): 0
DPC count (execution time 2000-3999 µs): 0
DPC count (execution time >=4000 µs): 0
_________________________________________________________________________________________________________
REPORTED HARD PAGEFAULTS
_________________________________________________________________________________________________________
Hard pagefaults are events that get triggered by making use of virtual memory that is not resident in RAM but backed by a memory mapped file on disk. The process of resolving the hard pagefault requires reading in the memory from disk while the process is interrupted and blocked from execution.
NOTE: some processes were hit by hard pagefaults. If these were programs producing audio, they are likely to interrupt the audio stream resulting in dropouts, clicks and pops. Check the Processes tab to see which programs were hit.
Process with highest pagefault count: chrome.exe
Total number of hard pagefaults 24489
Hard pagefault count of hardest hit process: 5590
Number of processes hit: 145
_________________________________________________________________________________________________________
PER CPU DATA
_________________________________________________________________________________________________________
CPU 0 Interrupt cycle time (s): 208,263250
CPU 0 ISR highest execution time (µs): 204,340
CPU 0 ISR total execution time (s): 61,071808
CPU 0 ISR count: 1888518
CPU 0 DPC highest execution time (µs): 687,40
CPU 0 DPC total execution time (s): 53,652528
CPU 0 DPC count: 8864732
_________________________________________________________________________________________________________
CPU 1 Interrupt cycle time (s): 18,795480
CPU 1 ISR highest execution time (µs): 13,860
CPU 1 ISR total execution time (s): 0,121094
CPU 1 ISR count: 29450
CPU 1 DPC highest execution time (µs): 75,510
CPU 1 DPC total execution time (s): 0,368887
CPU 1 DPC count: 33950
_________________________________________________________________________________________________________
CPU 2 Interrupt cycle time (s): 17,487201
CPU 2 ISR highest execution time (µs): 11,480
CPU 2 ISR total execution time (s): 0,007455
CPU 2 ISR count: 1266
CPU 2 DPC highest execution time (µs): 97,770
CPU 2 DPC total execution time (s): 0,047938
CPU 2 DPC count: 14700
_________________________________________________________________________________________________________
CPU 3 Interrupt cycle time (s): 17,085746
CPU 3 ISR highest execution time (µs): 0,0
CPU 3 ISR total execution time (s): 0,0
CPU 3 ISR count: 0
CPU 3 DPC highest execution time (µs): 50,020
CPU 3 DPC total execution time (s): 0,012045
CPU 3 DPC count: 7255
_________________________________________________________________________________________________________
CPU 4 Interrupt cycle time (s): 19,008099
CPU 4 ISR highest execution time (µs): 0,0
CPU 4 ISR total execution time (s): 0,0
CPU 4 ISR count: 0
CPU 4 DPC highest execution time (µs): 102,280
CPU 4 DPC total execution time (s): 0,126598
CPU 4 DPC count: 60714
_________________________________________________________________________________________________________
CPU 5 Interrupt cycle time (s): 17,244057
CPU 5 ISR highest execution time (µs): 0,0
CPU 5 ISR total execution time (s): 0,0
CPU 5 ISR count: 0
CPU 5 DPC highest execution time (µs): 49,010
CPU 5 DPC total execution time (s): 0,014232
CPU 5 DPC count: 7267
_________________________________________________________________________________________________________
CPU 6 Interrupt cycle time (s): 17,964584
CPU 6 ISR highest execution time (µs): 0,0
CPU 6 ISR total execution time (s): 0,0
CPU 6 ISR count: 0
CPU 6 DPC highest execution time (µs): 97,270
CPU 6 DPC total execution time (s): 0,271367
CPU 6 DPC count: 78678
_________________________________________________________________________________________________________
CPU 7 Interrupt cycle time (s): 12,104916
CPU 7 ISR highest execution time (µs): 0,0
CPU 7 ISR total execution time (s): 0,0
CPU 7 ISR count: 0
CPU 7 DPC highest execution time (µs): 68,060
CPU 7 DPC total execution time (s): 0,013844
CPU 7 DPC count: 4144
_________________________________________________________________________________________________________
CPU 8 Interrupt cycle time (s): 16,648381
CPU 8 ISR highest execution time (µs): 4,410
CPU 8 ISR total execution time (s): 0,006349
CPU 8 ISR count: 9220
CPU 8 DPC highest execution time (µs): 46,610
CPU 8 DPC total execution time (s): 0,041460
CPU 8 DPC count: 15073
_________________________________________________________________________________________________________
CPU 9 Interrupt cycle time (s): 11,168886
CPU 9 ISR highest execution time (µs): 3,670
CPU 9 ISR total execution time (s): 0,000303
CPU 9 ISR count: 352
CPU 9 DPC highest execution time (µs): 183,060
CPU 9 DPC total execution time (s): 0,015466
CPU 9 DPC count: 4316
_________________________________________________________________________________________________________
CPU 10 Interrupt cycle time (s): 17,592905
CPU 10 ISR highest execution time (µs): 4,270
CPU 10 ISR total execution time (s): 0,001808
CPU 10 ISR count: 2302
CPU 10 DPC highest execution time (µs): 122,910
CPU 10 DPC total execution time (s): 0,399520
CPU 10 DPC count: 81486
_________________________________________________________________________________________________________
CPU 11 Interrupt cycle time (s): 18,974417
CPU 11 ISR highest execution time (µs): 12,980
CPU 11 ISR total execution time (s): 0,002257
CPU 11 ISR count: 2732
CPU 11 DPC highest execution time (µs): 181,920
CPU 11 DPC total execution time (s): 0,590576
CPU 11 DPC count: 84921
Sistemi toplayalı 2 hafta oldu ancak 2 haftadır bu sorunu çözemedim. Bilgisayarım 3-4 saatte mutlaka 1 kere ve 1 saniyeliğine olmak üzere anlık donma yaşıyor ve seste beraberinde takılıyor. (metalimsi bir takılma sesi)
Latencymoon diye bir program ile hangi dosyada sıkıntı olduğunu öğrendim. Bir sürü foruma baktım yazılanları uyguladım fakat çözüm bulamadım. Driverları güvenli modda sildim tekrar yükledim, xmp kapattım, dedikleri bazı ayarları değiştirdim en sonunda format attım. Yine de olmadı. Tüm driverlar yüklü, BIOS son sürüm, chipset yüklü. Ses driverları ekran kartı ve anakart çakışıyordur belki diye sildim yine olmadı.
BIOS'un çipinde sorun olabilir mi? Eğer sorun donanımsal bir sorunsa anakartta mı problem var, öyleyse garantiye vereceğim. Yardım ederseniz sevinirim.
Sistemim: (Sadece SSD kullanıyorum)
MSI B450 Tomahawk Max
MSI RTX 2060 Super Gaming X
AMD Ryzen 5 3600
Cooler Master MB 511 RGB
XPG 1TB SX8200 PRO M.2 SSD
Corsair Vengeance 2x8 GB RAM RGB 3200mhz
CORSAIR Hydro Serisi H100i RGB PLATINUM
Ek olarak işlemcim default ayarlarda 3.6gz ile 1.4v ile çalışıyor, sanırım bu volt değeri normale göre yüksekmiş. 1.2'ye çektim AMD Ryzen Master ile ancak yinede düzelmedi. Yapmamı istediğiniz bir test vs varsa yaparım.
Bilgisayarı ilk açtığımdaki değerler bunlar ancak daha sonra birden 2. görseldeki hale geçiyor.
Storport.sys'de böyle 100 binlere çıkıyor.
CONCLUSION
_________________________________________________________________________________________________________
Your system appears to be having trouble handling real-time audio and other tasks. You are likely to experience buffer underruns appearing as drop outs, clicks or pops. One problem may be related to power management, disable CPU throttling settings in Control Panel and BIOS setup. Check for BIOS updates.
LatencyMon has been analyzing your system for 0:44:51 (h:mm:ss) on all processors.
_________________________________________________________________________________________________________
SYSTEM INFORMATION
_________________________________________________________________________________________________________
Computer name: DESKTOP-F13NCD9
OS version: Windows 10 , 10.0, build: 18363 (x64)
Hardware: MS-7C02, Micro-Star International Co., Ltd, B450 TOMAHAWK MAX (MS-7C02)
CPU: AuthenticAMD AMD Ryzen 5 3600 6-Core Processor
Logical processors: 12
Processor groups: 1
RAM: 16333 MB total
_________________________________________________________________________________________________________
CPU SPEED
_________________________________________________________________________________________________________
Reported CPU speed: 360 MHz
Note: reported execution times may be calculated based on a fixed reported CPU speed. Disable variable speed settings like Intel Speed Step and AMD Cool N Quiet in the BIOS setup for more accurate results.
WARNING: the CPU speed that was measured is only a fraction of the CPU speed reported. Your CPUs may be throttled back due to variable speed settings and thermal issues. It is suggested that you run a utility which reports your actual CPU frequency and temperature.
_________________________________________________________________________________________________________
MEASURED INTERRUPT TO USER PROCESS LATENCIES
_________________________________________________________________________________________________________
The interrupt to process latency reflects the measured interval that a usermode process needed to respond to a hardware request from the moment the interrupt service routine started execution. This includes the scheduling and execution of a DPC routine, the signaling of an event and the waking up of a usermode thread from an idle wait state in response to that event.
Highest measured interrupt to process latency (µs): 101118,90
Average measured interrupt to process latency (µs): 5,025299
Highest measured interrupt to DPC latency (µs): 101115,10
Average measured interrupt to DPC latency (µs): 1,859687
_________________________________________________________________________________________________________
REPORTED ISRs
_________________________________________________________________________________________________________
Interrupt service routines are routines installed by the OS and device drivers that execute in response to a hardware interrupt signal.
Highest ISR routine execution time (µs): 204,340
Driver with highest ISR routine execution time: dxgkrnl.sys - DirectX Graphics Kernel, Microsoft Corporation
Highest reported total ISR routine time (%): 0,188925
Driver with highest ISR total time: dxgkrnl.sys - DirectX Graphics Kernel, Microsoft Corporation
Total time spent in ISRs (%) 0,189555
ISR count (execution time <250 µs): 1933840
ISR count (execution time 250-500 µs): 0
ISR count (execution time 500-999 µs): 0
ISR count (execution time 1000-1999 µs): 0
ISR count (execution time 2000-3999 µs): 0
ISR count (execution time >=4000 µs): 0
_________________________________________________________________________________________________________
REPORTED DPCs
_________________________________________________________________________________________________________
DPC routines are part of the interrupt servicing dispatch mechanism and disable the possibility for a process to utilize the CPU while it is interrupted until the DPC has finished execution.
Highest DPC routine execution time (µs): 687,40
Driver with highest DPC routine execution time: nvlddmkm.sys - NVIDIA Windows Kernel Mode Driver, Version 441.66 , NVIDIA Corporation
Highest reported total DPC routine time (%): 0,075447
Driver with highest DPC total execution time: dxgkrnl.sys - DirectX Graphics Kernel, Microsoft Corporation
Total time spent in DPCs (%) 0,172038
DPC count (execution time <250 µs): 9257230
DPC count (execution time 250-500 µs): 0
DPC count (execution time 500-999 µs): 6
DPC count (execution time 1000-1999 µs): 0
DPC count (execution time 2000-3999 µs): 0
DPC count (execution time >=4000 µs): 0
_________________________________________________________________________________________________________
REPORTED HARD PAGEFAULTS
_________________________________________________________________________________________________________
Hard pagefaults are events that get triggered by making use of virtual memory that is not resident in RAM but backed by a memory mapped file on disk. The process of resolving the hard pagefault requires reading in the memory from disk while the process is interrupted and blocked from execution.
NOTE: some processes were hit by hard pagefaults. If these were programs producing audio, they are likely to interrupt the audio stream resulting in dropouts, clicks and pops. Check the Processes tab to see which programs were hit.
Process with highest pagefault count: chrome.exe
Total number of hard pagefaults 24489
Hard pagefault count of hardest hit process: 5590
Number of processes hit: 145
_________________________________________________________________________________________________________
PER CPU DATA
_________________________________________________________________________________________________________
CPU 0 Interrupt cycle time (s): 208,263250
CPU 0 ISR highest execution time (µs): 204,340
CPU 0 ISR total execution time (s): 61,071808
CPU 0 ISR count: 1888518
CPU 0 DPC highest execution time (µs): 687,40
CPU 0 DPC total execution time (s): 53,652528
CPU 0 DPC count: 8864732
_________________________________________________________________________________________________________
CPU 1 Interrupt cycle time (s): 18,795480
CPU 1 ISR highest execution time (µs): 13,860
CPU 1 ISR total execution time (s): 0,121094
CPU 1 ISR count: 29450
CPU 1 DPC highest execution time (µs): 75,510
CPU 1 DPC total execution time (s): 0,368887
CPU 1 DPC count: 33950
_________________________________________________________________________________________________________
CPU 2 Interrupt cycle time (s): 17,487201
CPU 2 ISR highest execution time (µs): 11,480
CPU 2 ISR total execution time (s): 0,007455
CPU 2 ISR count: 1266
CPU 2 DPC highest execution time (µs): 97,770
CPU 2 DPC total execution time (s): 0,047938
CPU 2 DPC count: 14700
_________________________________________________________________________________________________________
CPU 3 Interrupt cycle time (s): 17,085746
CPU 3 ISR highest execution time (µs): 0,0
CPU 3 ISR total execution time (s): 0,0
CPU 3 ISR count: 0
CPU 3 DPC highest execution time (µs): 50,020
CPU 3 DPC total execution time (s): 0,012045
CPU 3 DPC count: 7255
_________________________________________________________________________________________________________
CPU 4 Interrupt cycle time (s): 19,008099
CPU 4 ISR highest execution time (µs): 0,0
CPU 4 ISR total execution time (s): 0,0
CPU 4 ISR count: 0
CPU 4 DPC highest execution time (µs): 102,280
CPU 4 DPC total execution time (s): 0,126598
CPU 4 DPC count: 60714
_________________________________________________________________________________________________________
CPU 5 Interrupt cycle time (s): 17,244057
CPU 5 ISR highest execution time (µs): 0,0
CPU 5 ISR total execution time (s): 0,0
CPU 5 ISR count: 0
CPU 5 DPC highest execution time (µs): 49,010
CPU 5 DPC total execution time (s): 0,014232
CPU 5 DPC count: 7267
_________________________________________________________________________________________________________
CPU 6 Interrupt cycle time (s): 17,964584
CPU 6 ISR highest execution time (µs): 0,0
CPU 6 ISR total execution time (s): 0,0
CPU 6 ISR count: 0
CPU 6 DPC highest execution time (µs): 97,270
CPU 6 DPC total execution time (s): 0,271367
CPU 6 DPC count: 78678
_________________________________________________________________________________________________________
CPU 7 Interrupt cycle time (s): 12,104916
CPU 7 ISR highest execution time (µs): 0,0
CPU 7 ISR total execution time (s): 0,0
CPU 7 ISR count: 0
CPU 7 DPC highest execution time (µs): 68,060
CPU 7 DPC total execution time (s): 0,013844
CPU 7 DPC count: 4144
_________________________________________________________________________________________________________
CPU 8 Interrupt cycle time (s): 16,648381
CPU 8 ISR highest execution time (µs): 4,410
CPU 8 ISR total execution time (s): 0,006349
CPU 8 ISR count: 9220
CPU 8 DPC highest execution time (µs): 46,610
CPU 8 DPC total execution time (s): 0,041460
CPU 8 DPC count: 15073
_________________________________________________________________________________________________________
CPU 9 Interrupt cycle time (s): 11,168886
CPU 9 ISR highest execution time (µs): 3,670
CPU 9 ISR total execution time (s): 0,000303
CPU 9 ISR count: 352
CPU 9 DPC highest execution time (µs): 183,060
CPU 9 DPC total execution time (s): 0,015466
CPU 9 DPC count: 4316
_________________________________________________________________________________________________________
CPU 10 Interrupt cycle time (s): 17,592905
CPU 10 ISR highest execution time (µs): 4,270
CPU 10 ISR total execution time (s): 0,001808
CPU 10 ISR count: 2302
CPU 10 DPC highest execution time (µs): 122,910
CPU 10 DPC total execution time (s): 0,399520
CPU 10 DPC count: 81486
_________________________________________________________________________________________________________
CPU 11 Interrupt cycle time (s): 18,974417
CPU 11 ISR highest execution time (µs): 12,980
CPU 11 ISR total execution time (s): 0,002257
CPU 11 ISR count: 2732
CPU 11 DPC highest execution time (µs): 181,920
CPU 11 DPC total execution time (s): 0,590576
CPU 11 DPC count: 84921
Son düzenleyen: Moderatör: