Windows 10: AMD Adrenalin kurulumu sonrası mavi ekran

Sofiyev

Hectopat
Katılım
3 Aralık 2017
Mesajlar
51
Daha fazla  
Cinsiyet
Erkek
Dizüstü bilgisayarıma Windows 10 kurduğumdan beri bu sorunla karşılaşıyorum. Sorun tam olarak şöyle:

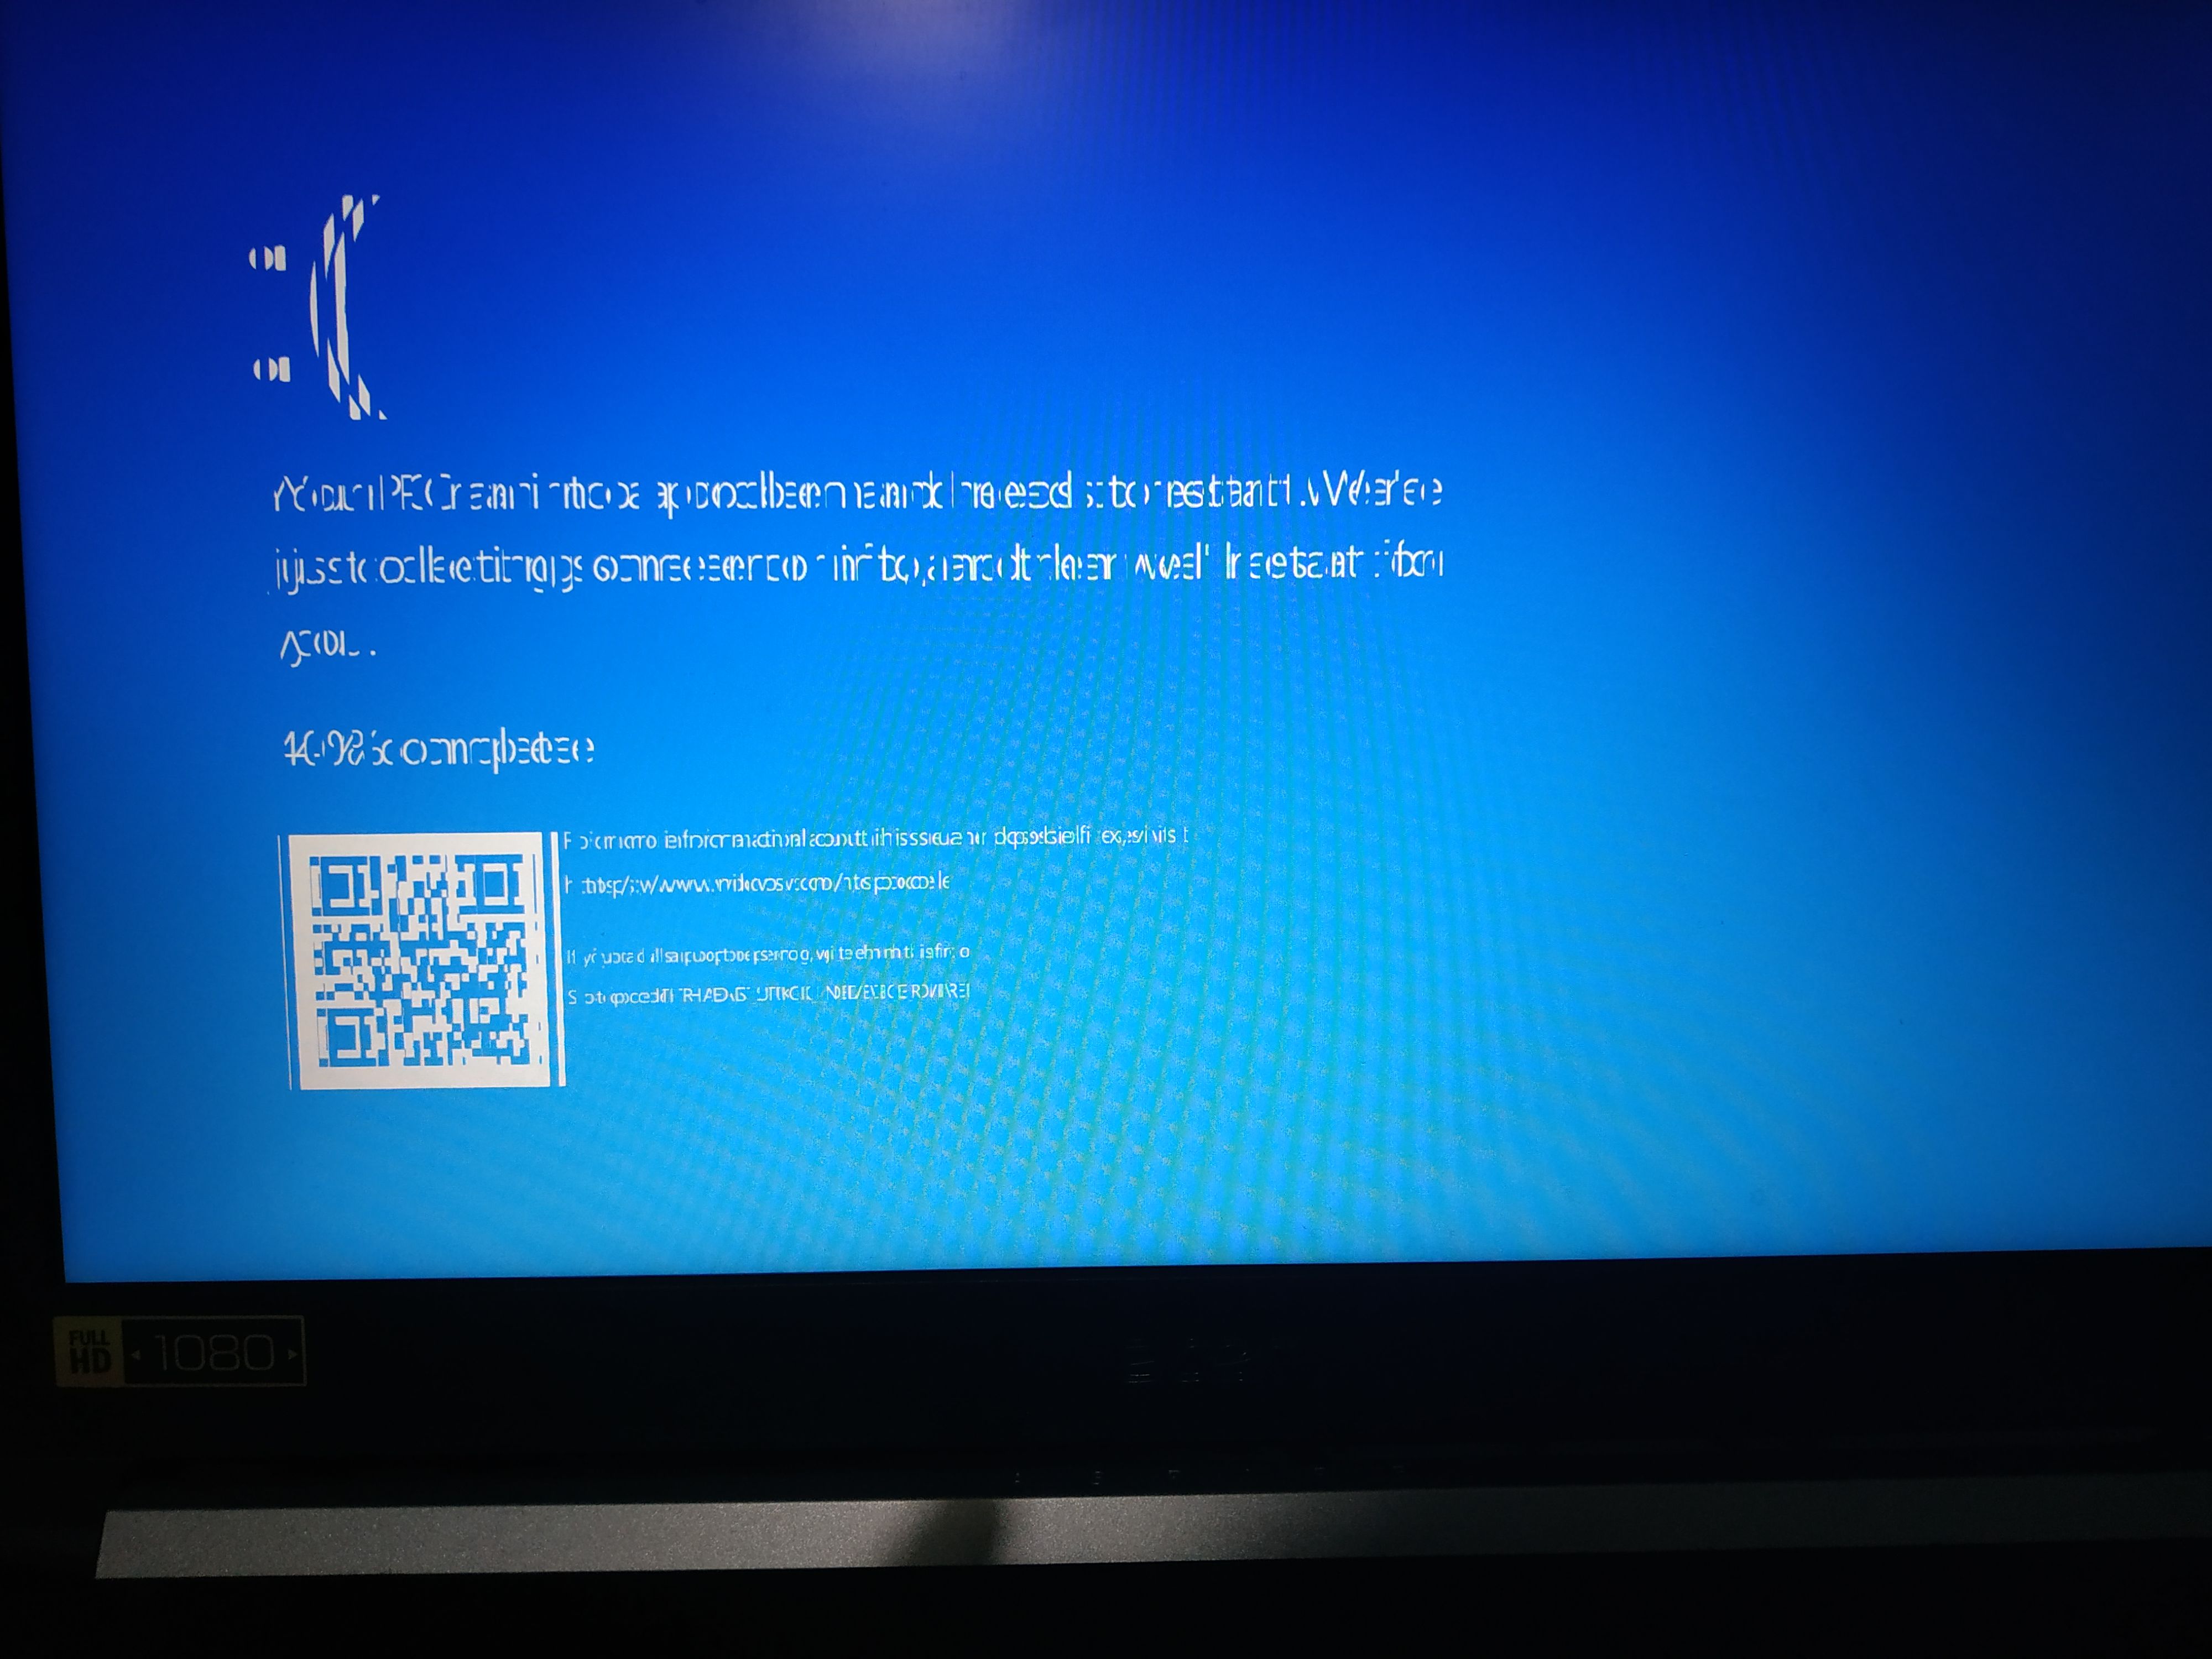
Bilgisayara Windows 10 kurdum, her şey sıkıntısız çalışıyor. AMD Adrenalin ( ekran kartı sürücüsü ) kurduktan sonra dizüstünün şarjını çıkarır çıkarmaz bu ekranla karşılaşıyorum.
IMG_20191002_214743.jpg


Sorun galiba ekran sürücüsünde, sürücüyü kurmasam şarjda ve şarjda olmadan sorunsuz çalışıyor. Ama sürücüden sonra sadece şarjda çalışıyor. Şarj kablosunu çıkardıktan hemen sonra yukarıdaki ekran çıkıyor.
 
Son düzenleyen: Moderatör:
DMP dosyalarını paylaşın.
 
DMP dosyalarını paylaşın.
Ayrıca sistem bilgilerinizide paylaşın.
Anakart Acer Aspire A515-41G
İşlemci QuadCore AMD A10-9620P, 3600 MHz (36 x 100)
Ekran kartı AMD Radeon R5 Graphics (512 MB)
Hard disk TOSHIBA MQ04ABF100 (1 TB, 5400 RPM, SATA-III)
 
Son düzenleme:
AMD GPU sürücünde bir eski sürüme dön. Dönmeden önce DDU ile kaldır.
Realtek güncelle.
Kod:
THREAD_STUCK_IN_DEVICE_DRIVER_M (100000ea)
The device driver is spinning in an infinite loop, most likely waiting for
hardware to become idle. This usually indicates problem with the hardware
itself or with the device driver programming the hardware incorrectly.
If the kernel debugger is connected and running when watchdog detects a
timeout condition then DbgBreakPoint() will be called instead of KeBugCheckEx()
and detailed message including bugcheck arguments will be printed to the
debugger. This way we can identify an offending thread, set breakpoints in it,
and hit go to return to the spinning code to debug it further. Because
KeBugCheckEx() is not called the .bugcheck directive will not return bugcheck
information in this case. The arguments are already printed out to the kernel
debugger. You can also retrieve them from a global variable via
"dd watchdog!g_WdBugCheckData l5" (use dq on NT64).
On MP machines it is possible to hit a timeout when the spinning thread is
interrupted by hardware interrupt and ISR or DPC routine is running at the time
of the bugcheck (this is because the timeout's work item can be delivered and
handled on the second CPU and the same time). If this is the case you will have
to look deeper at the offending thread's stack (e.g. using dds) to determine
spinning code which caused the timeout to occur.
Arguments:
Arg1: ffff950a1938a080, Pointer to a stuck thread object. Do .thread then kb on it to find
the hung location.
Arg2: 0000000000000000, Pointer to a DEFERRED_WATCHDOG object.
Arg3: 0000000000000000, Pointer to offending driver name.
Arg4: 0000000000000000, Number of times "intercepted" bugcheck 0xEA was hit (see notes).

Debugging Details:
------------------


KEY_VALUES_STRING: 1

Key : Analysis.CPU.Sec
Value: 8

Key : Analysis.DebugAnalysisProvider.CPP
Value: Create: 8007007e on DESKTOP-R1MKTM3

Key : Analysis.DebugData
Value: CreateObject

Key : Analysis.DebugModel
Value: CreateObject

Key : Analysis.Elapsed.Sec
Value: 102

Key : Analysis.Memory.CommitPeak.Mb
Value: 74

Key : Analysis.System
Value: CreateObject


BUGCHECK_CODE: ea

BUGCHECK_P1: ffff950a1938a080

BUGCHECK_P2: 0

BUGCHECK_P3: 0

BUGCHECK_P4: 0

FAULTING_THREAD: ffff950a1938a080

BLACKBOXBSD: 1 (!blackboxbsd)


BLACKBOXNTFS: 1 (!blackboxntfs)


BLACKBOXPNP: 1 (!blackboxpnp)


BLACKBOXWINLOGON: 1

CUSTOMER_CRASH_COUNT: 1

PROCESS_NAME: RadeonSettings.exe

STACK_TEXT:
fffff502`20cecac8 fffff800`1b380d75 : 00000000`000000ea ffff950a`1938a080 00000000`00000000 00000000`00000000 : nt!KeBugCheckEx
fffff502`20cecad0 fffff800`1b380e4e : fffff502`20cecbb8 fffff800`1b35bdeb fffff502`20cecbb8 fffff502`20cecc00 : dxgkrnl!TdrTimedOperationBugcheckOnTimeout+0x45
fffff502`20cecb40 fffff800`279724ca : 00000003`fcf7b125 fffff502`20cecc00 00000000`00000000 ffff950a`1ae0b000 : dxgkrnl!TdrTimedOperationDelay+0xce
fffff502`20cecb80 00000003`fcf7b125 : fffff502`20cecc00 00000000`00000000 ffff950a`1ae0b000 00000000`00000001 : atikmdag+0x724ca
fffff502`20cecb88 fffff502`20cecc00 : 00000000`00000000 ffff950a`1ae0b000 00000000`00000001 00000000`00989680 : 0x00000003`fcf7b125
fffff502`20cecb90 00000000`00000000 : ffff950a`1ae0b000 00000000`00000001 00000000`00989680 fffff502`00000000 : 0xfffff502`20cecc00


STACK_COMMAND: .thread 0xffff950a1938a080 ; kb

SYMBOL_NAME: dxgkrnl!TdrTimedOperationBugcheckOnTimeout+45

MODULE_NAME: dxgkrnl

IMAGE_NAME:  dxgkrnl.sys

IMAGE_VERSION: 10.0.18362.329

FAILURE_BUCKET_ID: 0xEA_IMAGE_dxgkrnl.sys

OS_VERSION: 10.0.18362.1

BUILDLAB_STR: 19h1_release

OSPLATFORM_TYPE: x64

OSNAME: Windows 10

FAILURE_ID_HASH: {ea458ad2-d5ab-aa6c-7a11-54653c70dfb8}

Followup:     MachineOwner
Realtek`i güncelledim. AMD Adrenalin sürümüm 19.9.3`tü. 19.7 yaptım, hata devam etti. 19.9.2 yaptım yine devam etti. Şuan 17.5 kurulu ve sıkıntısız çalışıyor. Oyunlarda performans düşüşü olacak mı bilmiyorum. 24-36 saat içinde merak edecekler için paylaşacağım. Yardımınız için teşekkür ederim.
 
Son düzenleyen: Moderatör:
Hocam merhaba birebir aynı ürün ve birebir aynı sorun bende de oluyor. Herhangi bir çözüm buldunuz mu? Kafayı sıyırmak üzereyim.
 
Son düzenleyen: Moderatör:
Kusura bakmayın geç gördüm.
Sorunu yabancı forumlarda da aradım, kesin bir çözüme ulaşamadım. Ekran kartı sürücüsünün eski sürümünü kurarak mavi ekran sorunu gideriliyor, fakat performans düşüşü oluyor. Şuan sorunu giderdim ama oyun oynayamıyorum.
 
Son düzenleyen: Moderatör:
Kusura bakmayın geç gördüm.
Sorunu yabancı forumlarda da aradım, kesin bir çözüme ulaşamadım. Ekran kartı sürücüsünün eski sürümünü kurarak mavi ekran sorunu gideriliyor, fakat performans düşüşü oluyor. Şuan sorunu giderdim ama oyun oynayamıyorum.
Ben sitedeki en eski sürüm olan 19.4.3'ü bile denedim fakat mavi ekran sorunu devam etti. Şuan Windows 7 ve son sürüm amd driverını kurdum herhangi bir sıkıntı yok.
 
Son düzenleyen: Moderatör:
Ben sitedeki en eski sürüm olan 19.4.3 ü bile denedim fakat mavi ekran sorunu devam etti. Şuan windows 7 ve son sürüm amd driverını kurdum herhangi bir sıkıntı yok.
Bu notebook`u aldığımda ben de win7 kurdum ama bileşenlerin sürücüleri sadece win10 destekliyordu, o yüzden win10 kullanmak zorunda kaldım. Sürücülerle ilgili herhangi bir problem çıktı mı?
 

Geri
Yukarı